Geoscience Reference
In-Depth Information
100
80
70
60
50
40
Trend line
(= -3.0% per year)
30
20
10
1950
1960
1970
1980
1990
2000
2010
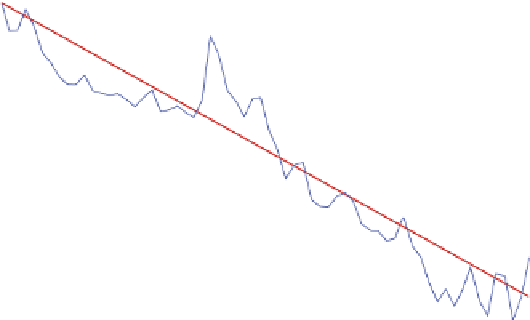
Figure 15.
Trends in the prices of farm products, United States, 1948-2011. The fi gure
shows the movement of farm prices relative to all prices.
nomic growth, as we saw earlier in this chapter. It will affect our ability
to reduce emissions at low cost (see Part III). But here, we need to ex-
amine the interaction of new technologies and climate change in deter-
mining food prices. One would expect adverse climatic conditions that
reduce yields to increase food prices. In economic terms, they would be
an adverse shift in the supply curve.
What are the trends and prospects for farm prices? Figure 15 shows
the trend in real farm prices over the last half century for the United
duced on farms to economy-wide prices. Farm prices are the prices re-
ceived by farmers, and this is the sector that is most sensitive to climate
change. (Note that farm prices move differently than food prices: Food
prices paid by consumers include other factors such as packaging, trans-
portation, and retail margins that are largely unaffected by climate
change, and these downstream costs move differently than farm prices.)
Over the last several decades, farm prices have declined at an average
rate of 3 percent per year. Real farm prices in 2011 were less than