Geoscience Reference
In-Depth Information
Geopotential heights
y
1
z
1
>
y
2
z
1
y
1
z
2
>
y
2
z
2
y
1
z
3
>
y
2
z
3
y
1
,
z
3
z
p
3
y
2
,
z
3
Geostrophic winds
U
g
1
< U
g
2
< U
g
3
U
g
3
p
2
x
y
1
U
g
2
p
1
y
2
U
g
1
North Pole
y
Fig. 6.4
Definition diagram to aid explanation of the thermal wind concept.
p
1
3
are pressure surfaces and their geopotential heights at
positions
y
1
and
y
2
are
y
1
z
1
3
and
y
2
z
1
3
respectively.
With reference to definition diagram Fig. 6.4, the
height of a particular pressure surface above sea level is
termed the
geopotential height
. Differences in vertical sep-
aration (thickness) between given isobaric surfaces are due
to temperature for any given pressure drop. This comes
out of the hypsometric equation for layer thickness,
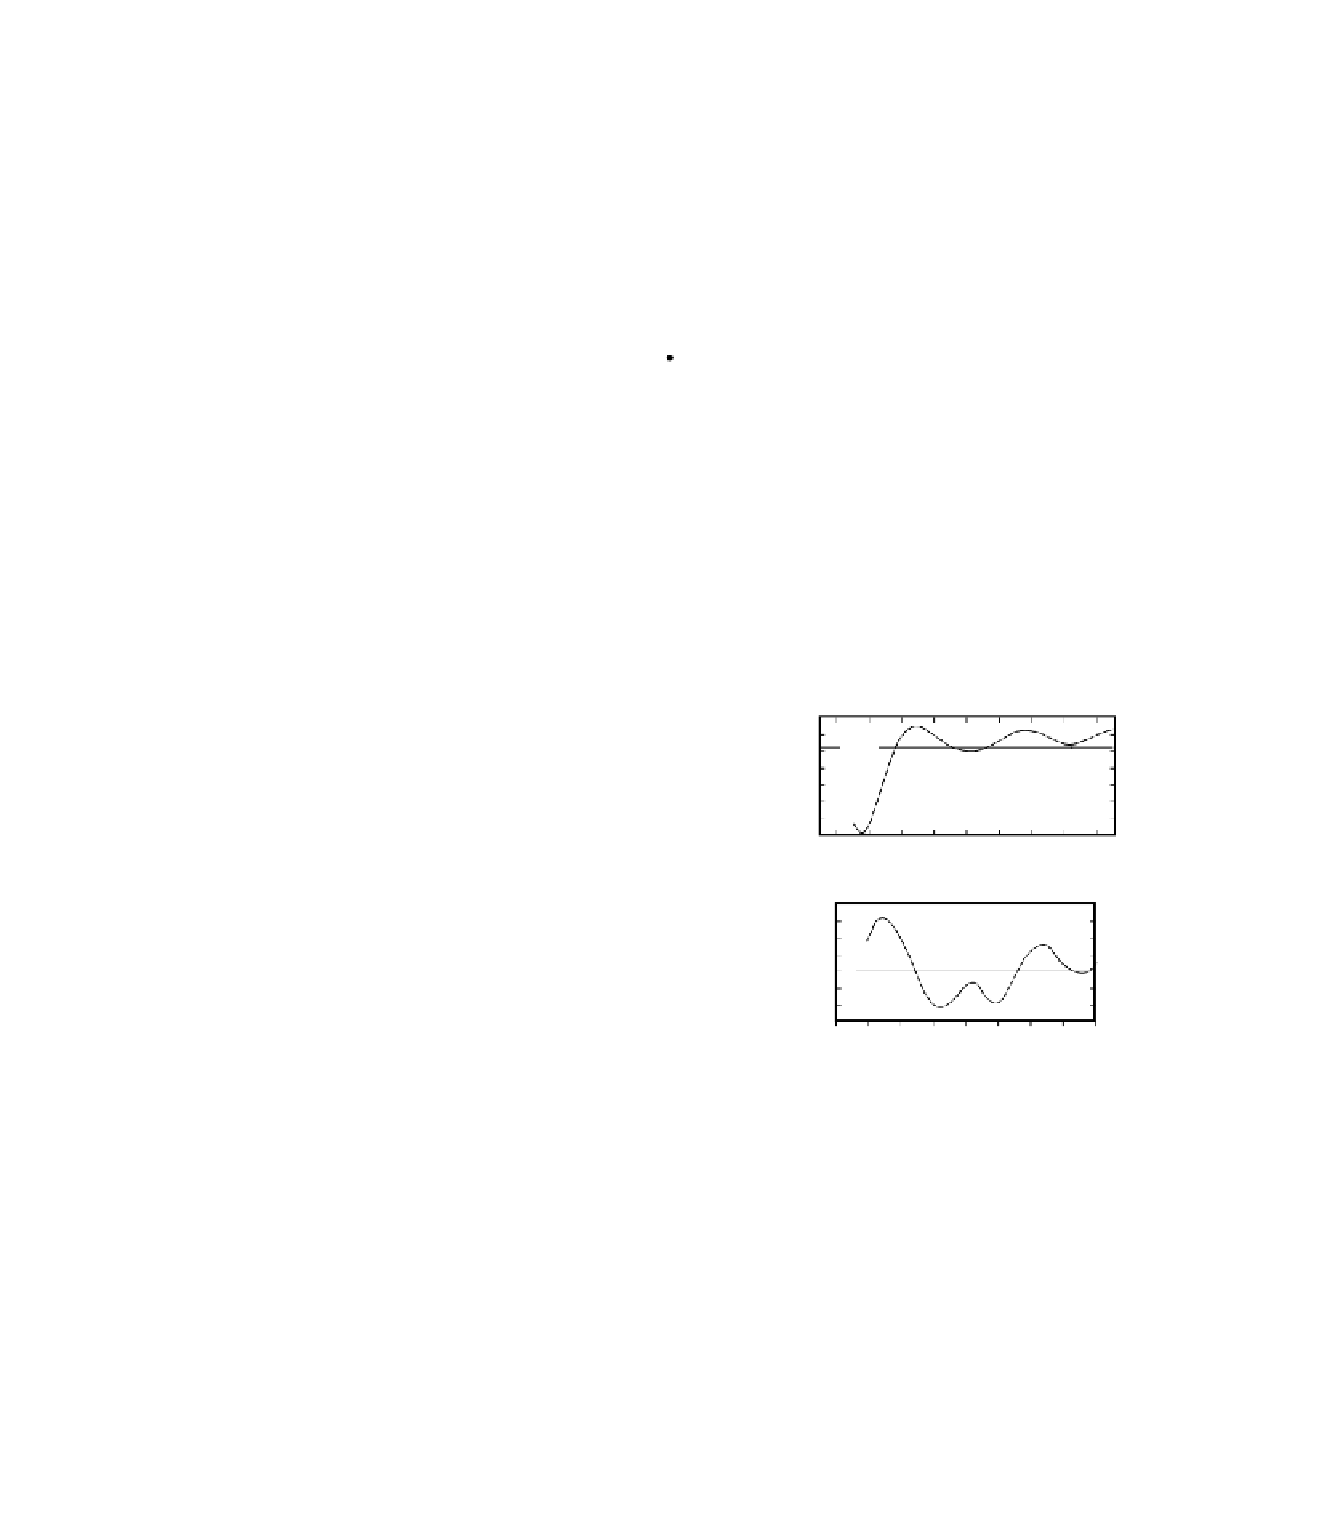
(a)
1020
mpsl
1010
1000
990
z
(Cookie 7). In warm air columns the layers thus have
greater thickness than those in cold ones, the cumulative
effect of layer-upon-layer of thickening leading to an
increasing slope of the isobars with height. For the case of
a negative poleward thermal gradient, we take as reference
the latitudinally averaged pressure surface low in the tro-
posphere, say at 1000 mbar, more-or-less at sea level.
Measurements here (Fig. 6.5a,b) show little overall hori-
zontal meridional pressure gradient, that is, the average
poleward pressure has no large systematic changes other
than those across the southern ocean and between the
Azores High and Iceland Low (see weather chart of
Fig. 3.21). This means that the
whole
mass of tropospheric
air that exerts the near-sea-level pressure field is distributed
about uniformly. Now take another pressure surface at
500 mbar in the middle of the troposphere where the air
above is much less dense (Fig. 6.4). The pressure surface
falls appreciably (of the order of 10-15%) due to the pole-
ward temperature gradient through 40-60
80S
60
40
20
0
20
40
60
80N
Latitude
(b)
6
4
Westerlies
0
2
Easterlies
4
60S
40
20
0
20
40
60N
Fig. 6.5
(a) Global meridional transect of mean annual zonal
pressures at sea level. Note influence of Antarctica and the southern
Ocean. (b) Corresponding mean air speeds. Note the inverse
relation to pressure gradient in Figure 6.4.
both summer and winter, the gradient with height
decreasing further poleward in both seasons and equator-
ward from about 30
N in summer. Generally the air below
a certain average isobar at the equator is warmer than
the corresponding high-latitude air below the same isobar.
The differential vertical expansion due to this means that the
poleward thermal gradient is accompanied by a horizontal
N latitude in


Search WWH ::

Custom Search