Geoscience Reference
In-Depth Information
In the late 1980s and 1990s, global oil supply began to in-
crease when better extraction techniques were developed and
new reserves, such as those in Alaska's North Slope and in the
North Sea of Europe, were systematically tapped. As a result,
prices fell dramatically to about $15 per barrel and Americans
generally moved away from fuel-efficient cars to sport utility ve-
hicles (SUVs), which consumed far more fuel. At the same time,
suburban development in the United States exploded in associa-
tion with urban sprawl (see Discover—
Urban Sprawl
above) and
the length of daily work commutes increased. Global oil prices
slowly began to rise again in 2004 and reached about $88 per
barrel in 2006, in large part because of rising demand in China
and India, which have rapidly growing populations. Prices rose
quickly in late 2007 and early 2008 when future supply fears,
speculation, and a weak dollar pushed the price of a barrel of oil
to over $140. This rapid increase caused prices at the pump to ex-
ceed $4 per gallon in many places within the United States. Just
as consumers were adjusting to this new reality, the world expe-
rienced a massive financial crisis in late 2008 and supply fears
decreased due to a deepening global recession. At that time, the
average price for a gallon of gas in the U.S. midwest was about
$2.70. Since then, the economy has gradually expanded and the
demand for petroleum thus increased. As a result, the average
price for a gallon of gas was about $3.40 in October, 2013.
At the time of the most recent economic downturn,
concerns abounded that global oil supplies were reaching a
critical level that could dampen economic growth for the fore-
seeable future. The U.S. economy has long been vulnerable to
tight supplies because we consume about 25% of the world's
oil (even though we have only 4% of the population) to keep
our industrial society humming. Given our own low supplies
of easily accessible oil, we now import about 60% of what
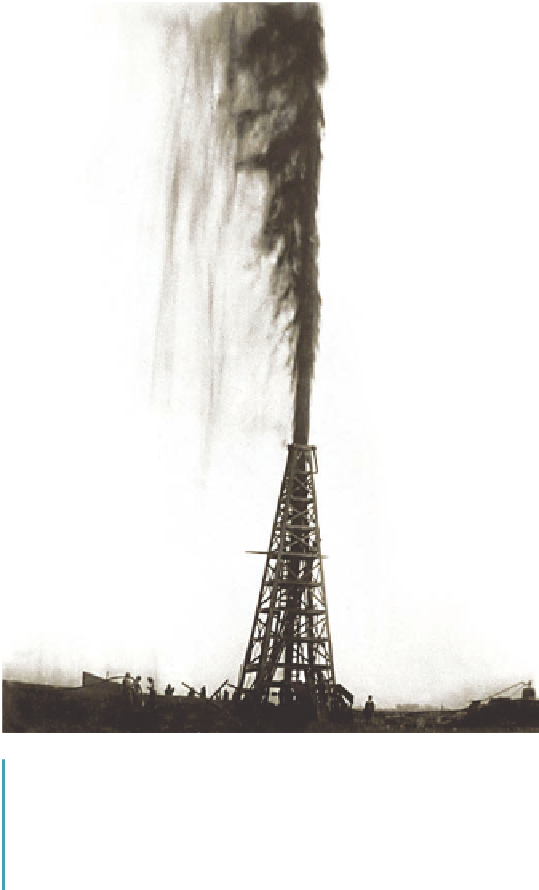
Figure 20.23 The Lucas gusher.
In 1901 the Corsican oil field
in southeastern Texas was tapped by Patillo Higgins, a self-
taught geologist. The pressure in the well was so great that the
oil (or “black gold”) erupted to a height of about 50 m (150 ft) for
9 days after the initial strike. Approximately 1,000,000 barrels of
oil were lost, which would be worth about $17,000,000 today.
approximately 4 billion barrels per year. At about this same
time, oil companies such as Shell and British Petroleum dis-
covered huge reserves in the Middle East and Venezuela that
dwarfed our own. These reserves were ultimately nationalized
by the host nations, which then formed the
Organization of
the Petroleum Exporting Countries
(OPEC) to coordinate pe-
troleum policies.
The economic geography of petroleum began to change
in the late 1960s as the United States slowly reached peak oil
production, which occurred in 1971. Our demand had grown
to the point where we had to import another 23% from for-
eign sources to meet our needs. Our vulnerable dependence
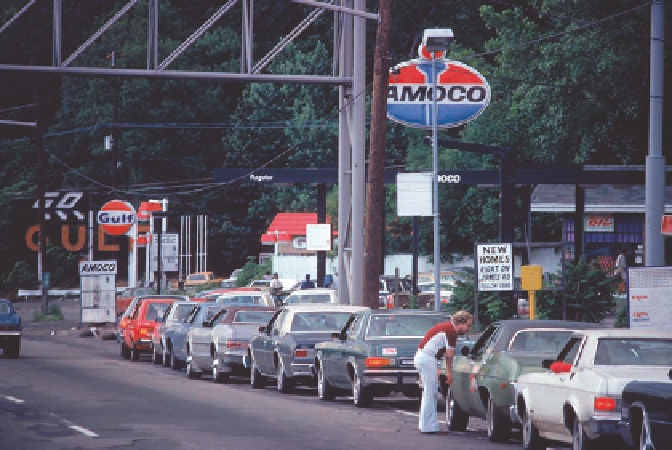
on foreign supplies first became apparent in 1973 when
OPEC organized an oil embargo to flex political muscle.
As a result of this disruption in supply, prices in the United
States jumped and long gas lines were commonplace (Figure
20.24). In an effort to conserve gasoline, the speed limit on
the nation's highways was lowered to 55 mph, and automo-
bile manufacturers focused on building fuel-efficient cars.
Yet another embargo occurred in 1979, further disrupting
supplies and increasing gas prices. Throughout most of the
1980s, global oil supplies were tight and prices at the pump
remained high.
Figure 20.24 Gas lines in the early 1970s.
Waiting for gasoline
like this was a common occurrence during the first oil embargo
because service stations often ran out of gas.