Geoscience Reference
In-Depth Information
Using Maps
Now that you have learned something about cartography, view
the animation
Using Maps
. The goal of this animation is to
increase your understanding of maps by interacting with them
online. This particular animation covers how maps are produced,
issues relating to scale, and the various kinds of data that can
be presented in a map. Once you finish this exercise, be sure
to answer the questions at the end to test your understanding
about maps.
Visual ConCept CheCk
2.2
a)
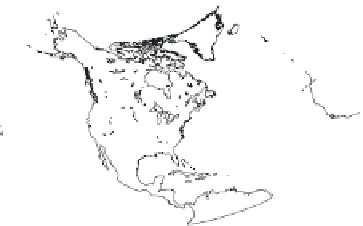
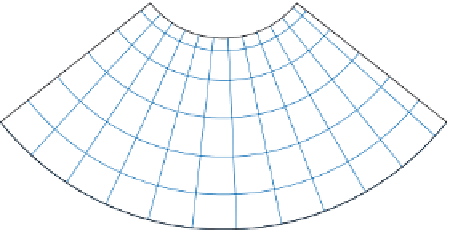
The process of map projection is the method through which three-dimensional features on Earth
are presented as a two-dimensional image. Two basic projections, conformal and equivalent, are
presented here. Which of these two maps is a conformal projection? Which one is the equivalent
projection? How can you tell the difference between the two?
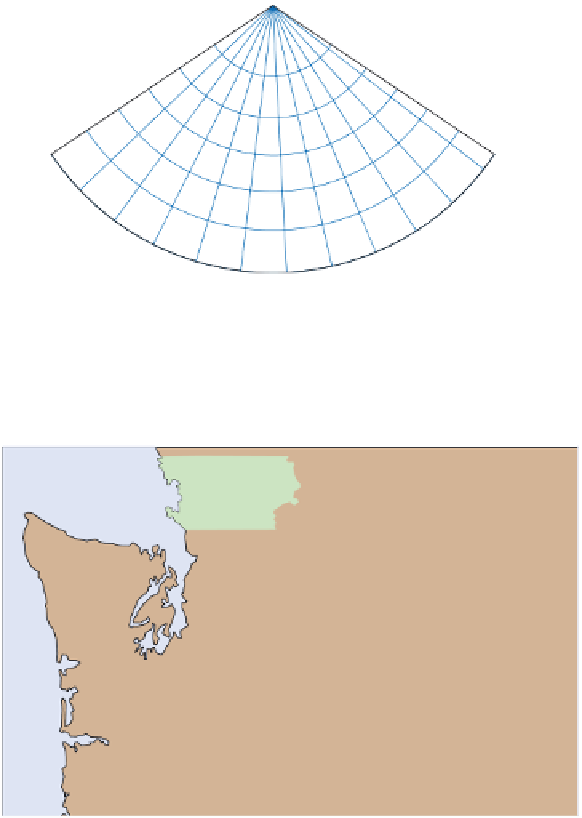
b)
The scale of a map depends on the amount and kind of information that a cartographer wishes to
present. In this case, two maps are presented that contain information about Seattle, Washington.
Which one of the maps is a relatively small-scale map? Which one is the large-scale map? How can
you tell the difference between the two?
Canada
Poulsbo
99
5
Puget
Sound
Puget
Sound
3
5
Lake
Washington
Lake
Washington
305
405
Bainbridge
Island
Bainbridge
Island
520
303
Spokane
Bellevue
Seattle
Seattle
90
90
310
304
Port Orchard
Port Orchard
Fauntleroy
5
156
82
Southworth
16
99
160
Renton
Renton
Cowley
Cowley
5
Burien
Auto/Passenger Ferries
Oregon
405
518
84
Passenger-Only Ferries