Geoscience Reference
In-Depth Information
contrast, represent much smaller geographic areas with a
greater level of detail because the representative fraction is
a larger number; that is, the size ratio on the map is closer
to the actual world. In order to obtain a better feel for map
scale, you should examine the information in Figure 2.18
and Table 2.2.
(a)
New York City
Written Scale
Representative
Fraction
1
31,680,000
1 in. = 500 miles
1 cm = 316 km
Small scale
Relatively large area
with low level of detail
(b)
1 in. = 150 miles
1 cm = 95 km
1
9,504,000
Medium scale
Relatively medium size
area with medium level
of detail
New York City
(c)
Large scale
Relatively small size
with high level of detail
1 in. = 8 miles
1 cm = 2 km
1
506,880
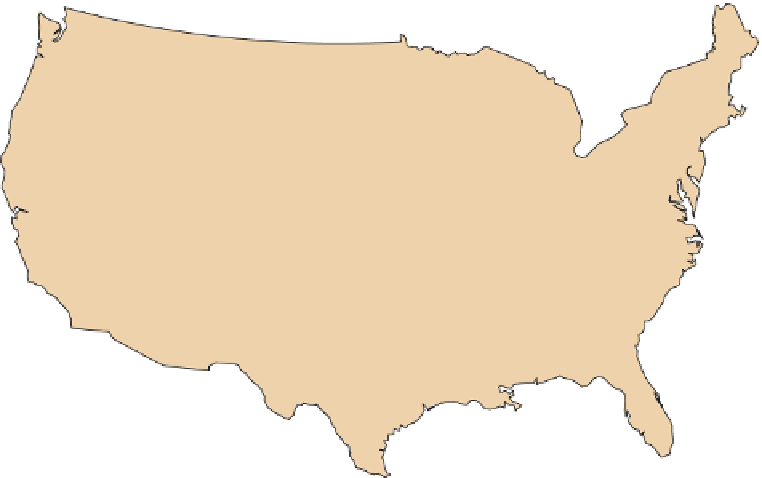
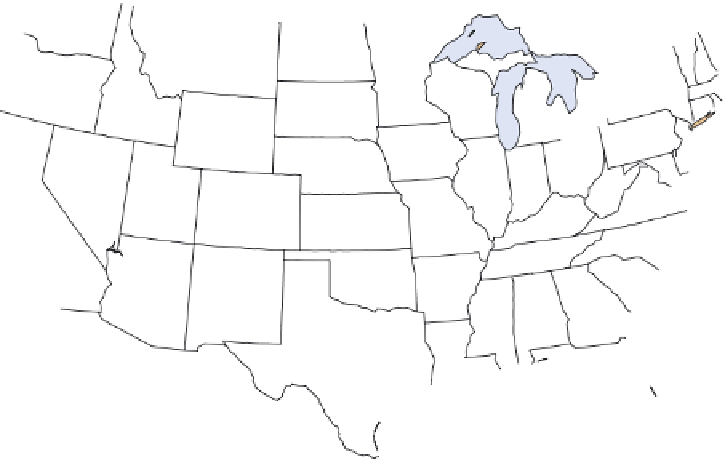
Figure 2.18 Examples of map scale.
Note that as scale increases, the amount of detail about a place increases. (a) Map of the
United States that shows the location of New York City. (b) Map of the state of New York showing the location of New York City.
Note that this map shows more detail (county boundaries) of the state of New York than (a). (c) Satellite image of New York City.
Note how much more detail of New York City can be seen in this image than in the other maps.