Geoscience Reference
In-Depth Information
Land
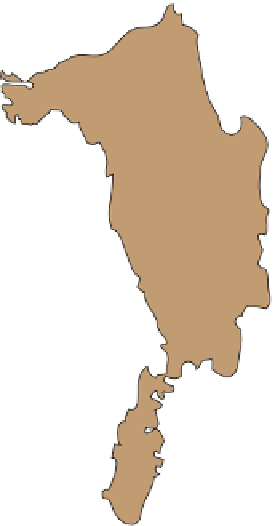
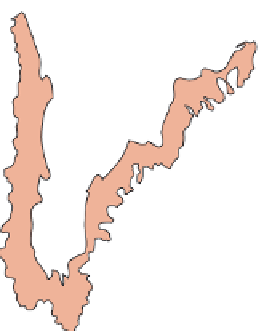
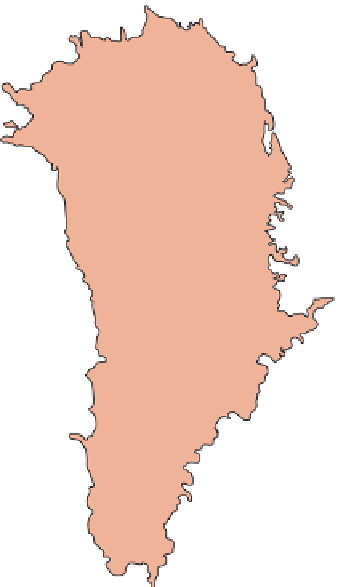
Melt area
Ice
200 km
1992
2002
2012
Figure 17.31 Recent melting of the Greenland Ice Sheet.
Notice the change in the
area of active melting in 1992, 2002, and 2012. (
Source:
NASA.)
of these features extend off the Antarctic landmass. During the
Antarctic summer of 2002, about 3500 km
2
of the Larsen B
Ice Shelf disintegrated. For scale, consider that the entire state
of Rhode Island is 2717 km
2
(1049 mi
2
) in size. Figure 17.32
shows the location of the ice shelf and the progression of its
breakup in two satellite images. The breakup is believed to be
due to the rapid warming (about 0.5°C [0.9°F] per decade) that
has occurred since the 1940s. This warming has had a profound
impact, causing the extent of seven ice shelves on the Antarctic
peninsula to decline by a total of about 13,500 km
2
(5212 mi
2
)
since 1974.
As evidence that these processes are still active, a chunk of
ice about 16 km (10 mi) wide and 80 km (50 mi) long rapidly
broke off the Greenland ice cap in late July 2010. This break
raised concerns that the ice cap may be reaching an important
threshold as far as its future stability is concerned.
Glaciers and Climate Change
Evidence strongly indicates that glaciers around the world are
melting at rapid rates due to climate change. These changes
have been documented at many glaciers through repeat pho-
tography and time-lapse imagery. To see examples of such
changes, go to the
Geo Media Library
and select
Glaciers
and Climate Change
. This animation contains an excellent
discussion of changes at Glacier National Park in Montana. It
also presents links to sites where glaciers have been closely
monitored in the past decade. Once you complete the exer-
cise, be sure to answer the questions at the end to test your
understanding.