Geoscience Reference
In-Depth Information
40,000
30,000
20,000
Measured discharge
10,000
Storm
event
Base flow
1000
700
Dec 06
Dec 13
Dec 20
Dec 27
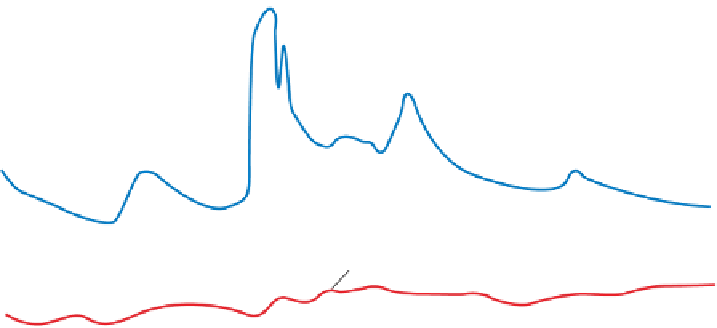
Figure 16.11 Rappahannock River hydrograph.
This hydrograph illustrates how discharge varied
during December 2003 (blue line) in the Rappahannock River near Fredericksburg, Virginia. Base flow
(red line) indicates the rate of flow maintained by groundwater influx. Note the peak that occurs in as-
sociation with increased runoff caused by a storm event. (
Source:
U.S. Geological Survey.)
is the flow rate that is sustained solely by groundwater influx.
During periods of heavy precipitation, the amount of runoff
to the stream increases, causing stream discharge to increase
above the base flow amount. Figure 16.11 is a typical
stream
hydrograph
that shows how stream discharge varies over the
course of time due to changes in groundwater influx and run-
off. This particular hydrograph is from the Rappahannock
River in Virginia and was collected over the course of a month
from a measuring station near the city of Fredericksburg. No-
tice the relationship between base flow and the actual amount
of discharge. Also observe the fluctuations in discharge that
occurred over the month. In particular, note that stream dis-
charge does not immediately increase during a storm event.
This
time lag
between the period of heaviest rainfall and
maximum stream discharge is typical of most streams be-
cause it takes a period of time for the water to flow overland
and reach the channel. This concept will be discussed more
thoroughly later in the chapter.
Flooding
Although streams are usually well confined within
their channels, the amount of water in them can increase dra-
matically during periods of high rainfall and runoff. During
these intervals, the first noteworthy rate of heightened stream
flow is
bankfull discharge
, when the channel is literally full
of water. If the amount of runoff further increases so that water
begins to spill out of the channel onto the adjoining ground,
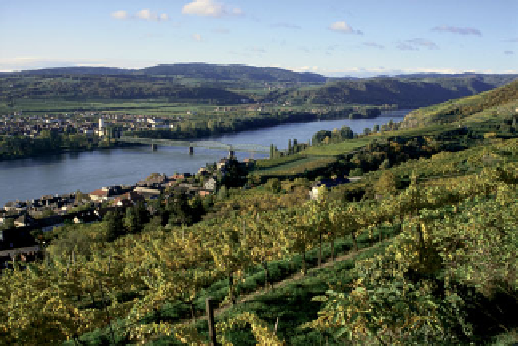
VISUAL CONCEPT CHECK
16.1
The famous Danube River, shown here, is the
second longest river in Europe (the Volga is the
longest), flowing from Germany to the Black Sea.
Which one of the following statements is correct
and can be determined accurately?
a)
The Danube is a high-order stream.
b)
The discharge of the Danube is low.
c)
The watershed of the Danube is small.
d)
The slope of the Danube is very steep.