Geoscience Reference
In-Depth Information
Plant Succession
Let's take a closer look at the concept of plant succession by
watching the sequence of plants that populate a more complex
landscape than the dunes just described. Go to the
Geo
Media Library
and select
Plant Succession
. This animation
illustrates the process of secondary plant succession in a cool,
humid landscape in the higher midlatitudes. The environmental
stage is set with a small stream that flows through a forested
area about 7000 years ago. Subsequently, a colony of beaver
builds a dam across the stream, causing a pond to form. From
this point, watch how the succession of plants proceeds in this
environment, culminating in the complete disappearance of the
pond and return of climax vegetation. Once you complete the
animation, be sure to answer the questions at the end to test
your understanding of plant succession.
Human Interactions: Human
Influence on Vegetation Patterns
As noted earlier, the discussion about plant biomes and
local vegetation factors assumed the potential natural veg-
etation of an area or region. In other words, it was based on
the character of plant communities as they would naturally
occur without human impacts. The reality is, however, that
“natural vegetation” in its purest form is rather rare today in
this era of intense human interactions with the environment.
People have had a growing impact on local, regional, and
global plant communities for the past two centuries, which
has intensified since the onset of the industrial age. In the
contiguous United States, for example, it is very difficult to
find vegetated landscapes that have not been altered in some
way by humans, either through clearing of forest or plowing.
To see where we are today, examine Figure 10.26,
which is a map that expresses as a percentage the relative
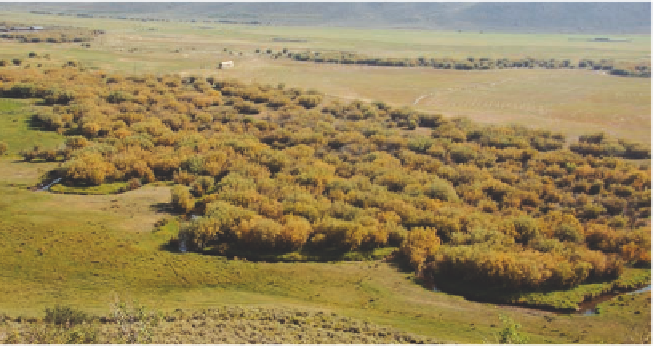
Figure 10.25 An example of riparian vegetation.
An overlook
in Wyoming provides a great view of riparian vegetation along a
small stream. In the surrounding hills the plant community con-
sists of very short grass and sagebrush, while the relatively moist
valley bottom supports this dense stand of trees.
Figure 10.26 Human footprint
on global biomes.
This map
expresses as a percentage the
relative human footprint on glob-
al biomes. Values range from 0
(least influenced) to 100 (most
influenced). Note the major foot-
print in places like Europe and the
eastern United States, whereas
places like the Sahara Desert and
northern Canada have experi-
enced low human impacts.
Robinson Projection
Wildlife Conservation Society (WCS), and Center
for International Earth Science Information Network
(CIESIN)/Columbia University. 2005. Last of the
Wild Project, Version 2, 2005 (LWP-2): Global
Human Footprint Dataset (Geographic). Palisades,
NY: NASA Socioeconomic Data and Applications
Center (SEDAC).
Human Footprint Index
1
10
20
30
40
60
80