Geoscience Reference
In-Depth Information
(a)
(b)
Figure 9.25 Powering the global economy.
(a) Times Square, New York City, at night. A tremendous amount of electricity is required
to power the urban landscape. (b) Traffic in Saõ Paulo, Brazil. This type of scene, with thousands of cars burning gasoline, is played out in
countless places around the world at any given point in time.
to load the prehistoric equivalent of 16.2 hectares (40 acres) of
wheat—stalks, roots, and all—into the tank of your car just to
drive 20 mi. In this context, the United States currently leads
the world by consuming about 25% of the annual global energy
supply. This lead exists despite the fact that the United States is
home to only 4% of the world's approximately 6 billion people.
Of the total amount of energy consumed in the United States in
2012, about 82% was derived from fossil fuels.
Through this global reliance on fossil fuels, humans have
dramatically increased the amount of atmospheric carbon di-
oxide over time. In 1950, for example, approximately 5 billion
metric tons of carbon was released into the atmosphere through
industrial pathways. By 2010 this transformation of fossil fuel
to atmospheric carbon dioxide had increased to over 30 billion
metric tons. Approximately 50% of these total emissions has
moved from the atmosphere and is stored in reservoirs such
as the oceans and forests. The remaining 50%, however, has
remained in the atmosphere.
To see the changes in atmospheric CO
2
concentrations in
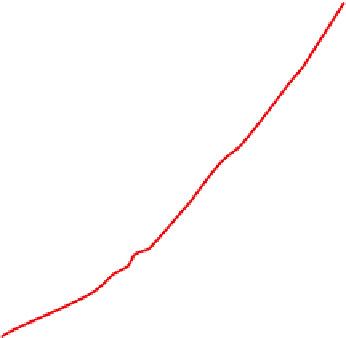
the industrial era, look at Figure 9.26. In 1850, the concen-
390
380
370
360
350
Direct observation
340
330
320
310
Ice core record
300
290
280
1850 1860 1870 1880 1890 1900 1910 1920 1930 1940 1950 1960 1970 1980 1990 2000 2010
Figure 9.26 Changes in atmospheric carbon dioxide since 1850.
Carbon dioxide levels have increased over 30% since
1850 and continue to rise. The black line represents atmospheric concentrations derived from ice core data. The red line
is derived from actual atmospheric measurements taken by the Scripps Institute of Oceanography. (
Sources
: Pre-1958: A.
Neftle et al., Historical CO
2
record from the Siple Station ice core, in Trends: A Compendium of Data on Global Change, 1994,
U.S. Department of Energy. Post-1958: Earth Systems Research Laboratory (ESRL) National Oceanic and Atmospheric Ad-
ministration (NOAA).)


