Geoscience Reference
In-Depth Information
(c)
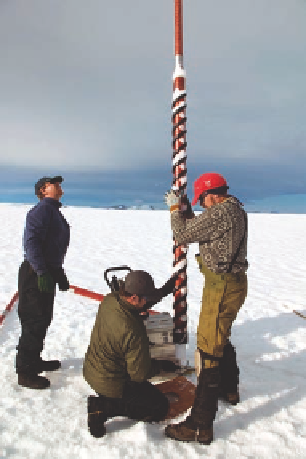
Figure 9.18 Ice cores.
(a) Coring the Greenland ice cap. The
scientists pictured here are drilling into the ice to obtain a sam-
ple for detailed analysis. (b) An example of an ice core extracted
from the Greenland ice cap. When this portion of the core was
extracted, scientists marked its depth so its position in the ice
would remain known. For preservation, it is kept in a storeroom
at a consistent temperature of -25°C (-13°F). (c) An example of
ice layers, showing distinct bands within the ice. Each of these
bands represents an annual layer of snow that transformed to
glacial ice. Each layer contains a sample of the atmosphere at
the time the snow fell, including the relative amount of O-16 and
O-18.
(a)
to acquire samples of the various layers. Both the marine sedi-
ments and glacial ice masses gradually thicken with time, and the
annual records of this growth are preserved. Although the coring
process is essentially the same in both marine and ice settings,
the method is much easier to visualize on a glacier (Figure 9.18).
Members of a coring expedition pick a place where the ice is
expected to contain the best annual sequence of isotopic data.
Once they arrive there, they set up a station (Figure 9.18a) where
a core tube can be drilled vertically into the glacier, through a
large number of ice layers, to a great depth. With this tube, they
can extract a cylinder of ice (Figure 9.18b) that contains a sample
of what is, in effect, all the annual snowfalls (and thus the an-
nual ratio of O-16/O-18) they can penetrate. Once the core is ex-
tracted, scientists merely have to count the layers (Figure 9.18c)
to record the length of time represented in the cylinder of ice and
then determine changes that occur in the ratio of O-16 and O-18
over time.
A composite record of cores demonstrates a sequence of
distinct
oxygen isotope stages
(Figure 9.19) that reflect ma-
jor climate changes that have occurred through the Quaternary
Period. This record is particularly relevant to reconstructing
glacial cycles, indicating that massive ice sheets advanced and
(b)
in which O-18 and O-16 move relative to each other within the
hydrologic cycle during a glacial period. The diagram shows a
hypothetical air mass that flows away from its tropical source
area toward a growing glacier at high latitudes. Note that rela-
tively more O-16 is evaporated from the ocean than O-18 dur-
ing this glacial cycle. This leaves proportionately more O-18 in
the seawater, which is absorbed by microscopic marine organ-
isms called
benthic foraminifera
that live on the ocean bottom.
As the air mass flows toward the center of the growing gla-
cier, precipitation occurs and O-18 is the first oxygen isotope
to be lost because it is the heavier isotope. By the time the air
mass reaches the center of the ice mass, the oxygen isotopes
are mostly O-16. In this way, the marine sediments (which con-
tain the benthic foraminifera) become relatively enriched in
O-18 (because O-16 is preferentially evaporated) at the same
time that thickening glacial ice contains proportionately more
of the O-16 isotope (because most O-18 was left behind or
precipitated earlier).
So how do scientists reconstruct this record of climate
change? In a method somewhat similar to acquiring pollen data,
they take cores of the marine sediments and of large ice masses
Oxygen isotope stages
Periods of time that have distinct
O-18/O-16 ratios, which are used to reconstruct prehistoric
climate change.