Geoscience Reference
In-Depth Information
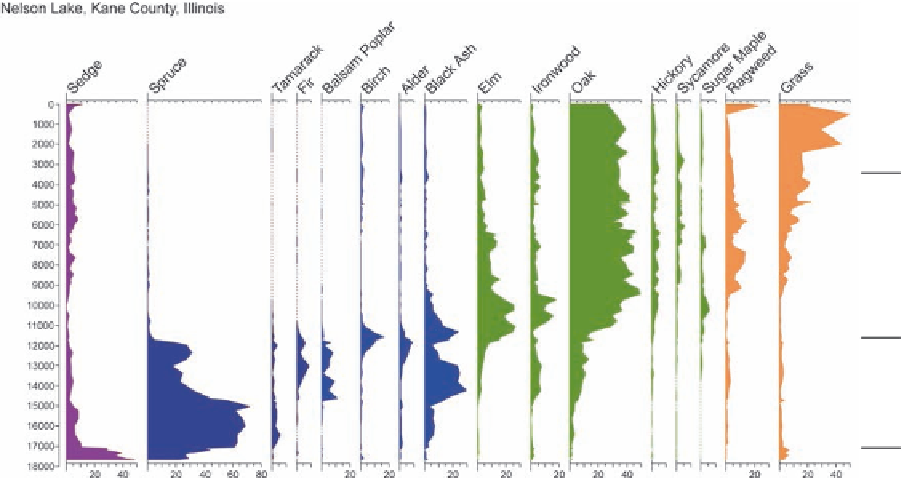
Warm, slightly drier climate when
grass population increased.
Warm, humid climate when
oak prevailed.
Cool, humid climate when
spruce prevailed.
Cold, dry climate when
tundra prevailed.
Percent
Figure 9.15 Pollen diagram from Nelson Lake, Illinois.
Note the vegetation change through time and how it relates to climate fluctua-
tions presented on the right-hand side of the graph. (
Source
: Eric Grimm, Illinois State Museum.)
so, a palynologist acquires a core (vertical sample) of the lake-
bottom sediments and returns it to the laboratory where the
pollen can be extracted from each layer of sediment and then
analyzed.
Once the data are acquired from each layer of sediment, a
diagram is created that shows the change in pollen in the area
over time. This pattern of change is then used to reconstruct the
climate history. The pollen diagram from Nelson Lake, Illinois
(Figure 9.15) is a good example and should be interpreted in
this way. Begin by looking at the vertical axis, which shows the
age in years before the present, beginning with 17,000 years
ago and ending today (0). From left to right across the top of the
graph are the various plant species identified in the core sam-
ples, ranging from sedge on the left to grass on the right. The
relative percentages of each of these plant species are shown at
the bottom of each plant column. For example, around 15,000
years before the present, spruce trees accounted for about 60%
of the overall sample, whereas the amount of oak pollen was
very small. Approximately 10,000 years before the present,
however, spruce pollen made up 0% of the sample, whereas oak
was over 40%.
Using these percentage changes through time, a palynolo-
gist can reconstruct the climate for the Nelson Lake area for the
past 17,000 years. The high amount of sedges between 17,000
years and 14,000 years before the present reflects a cold, dry
climate when tundra prevailed in the area. As you will learn
in Chapter 17, this climate/vegetation combination existed be-
cause an enormous glacier was nearby. Some 14,000 years ago,
the climate became warmer and more humid, which caused tun-
dra to be replaced by spruce, which is a needle-leaf tree. Spruce
dominated the local vegetation until about 11,000 years before
the present, when the climate apparently warmed sufficiently
to allow the influx of oak (a deciduous tree) at the expense of
spruce. Oak has dominated for the past 10,000 years at Nelson
Lake, although grass has increased in the past 2000 years. This
expansion of grass is probably related to the climate becoming
slightly warmer and drier.
Tree Ring Patterns
Another way that past climate change can be reconstructed
is through the analysis of tree rings. This method is based on
the fact that most trees produce annual growth rings, such as
those shown in Figure 9.16a, over the course of their lives. In
trees that have such ring patterns, each ring consists of a dark
and light wood couplet, with the dark wood representing the
winter period when growth is slow or nonexistent and the light
wood reflecting rapid growth in summer. When local climate
conditions are favorable, the rings are wide, whereas they are
narrower (reflecting less growth) when it is colder or drier,
depending on the type of tree.
The study of tree rings is called
dendrochronology
and can
be used to reconstruct the history of regional climate change. A
scientist begins such a study by obtaining a small core from a
tree with a device called an increment borer. To obtain such a
core, the implement is first screwed horizontally into the center
Dendrochronology
The dating of past events and variations
in the environment and climate by studying the annual growth
rates of trees.