Geoscience Reference
In-Depth Information
15
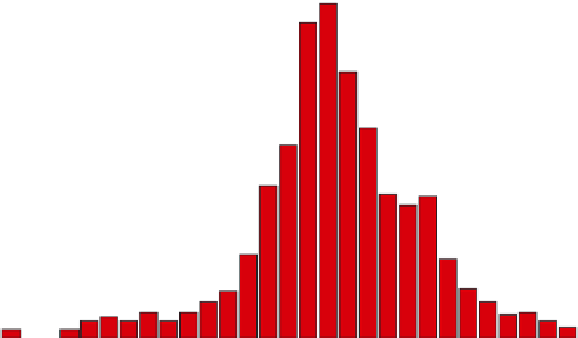
Figure 8.22 Average frequency of
monthly hurricanes in the Atlantic Ocean
from 1896 through 1996.
Hurricanes
are most likely to develop from the begin-
ning of August to the end of October be-
cause sea-surface temperatures are warm-
est during this time of year in the Northern
Hemisphere.
September
23
October
31
June 1
August 4
10
December
11
5
0
Time of year
particular combination of environmental variables. Most im-
portantly, they require an abundance of latent heat energy to
fuel their development. Such an abundance of energy can oc-
cur only when a great deal of evaporation from the underlying
ocean takes place, which means that the surface waters must be
warmer than about 27°C (80°F). This required temperature is
the primary reason why hurricane season in the Atlantic Ocean
largely occurs from August to October (Figure 8.22), in other
words, in the period following the highest Sun and insolation.
In addition to the warm ocean waters, another requirement
for hurricane development is that the upper air wind pattern
must be favorable, with high air pressure aloft. This relation-
ship may seem strange because hurricanes are zones of low air
pressure, which might lead you to wonder how both low pres-
sure at the surface and high pressure in the upper atmosphere
could exist at the same time. Remember that the atmosphere has
many different layers and that air can flow differently in each of
them. In the case of a hurricane, high pressure aloft is required
because it serves to “cap” the top of the storm so that it can
continue to strengthen at the surface. Otherwise, if the surface
air can freely convect into the upper atmosphere, or if shearing
winds aloft blow the top off the storm, then the system does not
fully organize.
If all the necessary ingredients are in place for hurri-
cane development, the system can grow to immense size and
strength. Depending on the specific atmospheric conditions,
hurricanes can range in diameter from 150 km to 500 km
(100 mi to 300 mi). Hurricanes acquire their strength because
of the steep pressure gradient that develops from the outside of
the storm to a center of extremely low pressure, which can de-
press to 900 mb or even lower. As a result of this steep pressure
gradient, winds spiral into the core of the system at very high
speed. Figure 8.23 shows an example of the pressure gradient
and storm size.
Hurricanes are classified based on their wind-speed inten-
sity on the Saffir-Simpson scale. Table 8.2 shows this scale
and how it relates to the central pressure of a storm and its
wind speed. Notice the inverse relationship between these two
variables. The fourth column of the table shows storm surge,
which is the rise in sea level that occurs because strong winds
cause water to pile up ahead of the storm. Storm surge is typi-
cally highest from a geographical perspective on the right front
quadrant of a hurricane, where onshore winds flow as the storm
approaches. These winds tend to push the water ahead of the
storm and onto the coast. In addition to wind speed, the height
of a storm surge depends on the timing of the tides and con-
figuration of the coastline, with shallow coastlines typically
more susceptible because water has a tendency to pile up at
those locations.
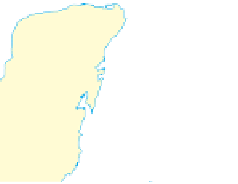
Florida
Gulf of Mexico
Bahamas
0
300 km
0
200 mi
Cuba
Yucatán
Peninsula
Figure 8.23 Hurricane weather map.
This simplified weather
map of a typical Atlantic hurricane illustrates the cyclonic rotation
and pressure gradient associated with the system. Shaded areas
are regions of heavy rainfall.