Geoscience Reference
In-Depth Information
Warm air,
Large capacity
Cool air,
Moderate capacity
Cold air,
Small capacity
RH = 100%
RH = 50%
RH = 20%
(a)
4 A.M.
5°C (41°F)
10 A.M.
15°C (59°F)
3 P.M.
30°C (86°F)
Figure 7.10. Relationship among air temperature, time
of day, and relative humidity.
Although specific humidity
does not change in this example, maximum humidity
increases while relative humidity decreases.
specific humidity to maximum humidity becomes less. If you
lived in a place where such a daily temperature/humidity change
occurred, you might notice that the air became slightly less sticky
as it warmed over the course of the day.
Dew-Point Temperature
As shown in Figure 7.10, the relative humidity of a hypothetical
air mass decreased over the course of an imaginary day because
the temperature warmed from 5°C (41°F) to 30°C (86°F), creating
a larger capacity to hold water vapor in the afternoon. This de-
crease in relative humidity occurred despite the fact that the spe-
ciic humidity
did not change
. Assuming that the air mass would
cool over the course of the evening and by early morning would
be back to 5°C (41°F), without any change in specific humidity,
what would the relative humidity be? To calculate this value, sim-
ply work backward in the process and watch how the capacity of
the air mass to hold moisture decreases until it is saturated. In this
particular example, if the air cooled to 15°C (59°F), the relative
humidity would increase to 50%. If the air continued to cool to
5°C (41°F), then the relative humidity would rise to 100%.
Another way to look at this example is to say that the
dew-point temperature
of this air mass is 5°C (41°F). The
(b)
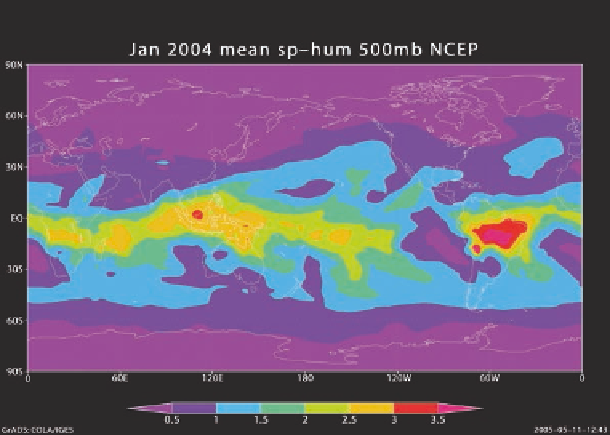
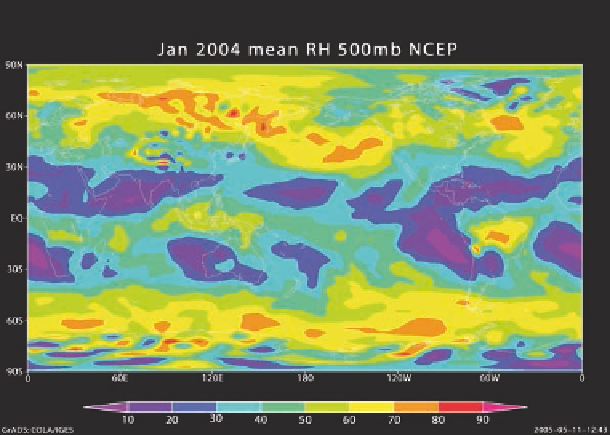
Figure 7.9 Humidity maps.
(a) A direct correlation appears be-
tween specific humidity and latitude in the lower atmosphere (as
reflected at the 500-mb pressure surface). Reds and yellows in-
dicate high values of average specific humidity, whereas greens,
blues, and purples are progressively lower levels of specific hu-
midity. (b) Higher latitudes usually have higher relative humidity,
as indicated by the orange and yellow shades. Greens, blues, and
purples represent areas with lower amounts of relative humidity.
The same kinds of changes in relative humidity associated
with latitude can also be seen over a typical day at any location
that experiences strong diurnal changes in temperature—in other
words, changes that occur over the course of a day and night.
Figure 7.10 shows air temperature warming over the course of
the day from 4:00 a.m. to 3:00 p.m. As the warming process con-
tinues, the maximum humidity increases because the capacity to
hold vapor becomes greater. In contrast, the specific humidity,
represented by the blue shading, does not change between the
morning and afternoon hours. What happens to relative humid-
ity as the day progresses? It gradually decreases as the ratio of
Dew-point temperature
The temperature at which conden-
sation occurs in a definable body of air.