Geoscience Reference
In-Depth Information
25
80
900
800
20
70
June 21
Topeka
700
15
60
600
Equinoxes
San Francisco
500
10
50
400
December 21
5
40
300
200
0
30
100
-5
20
0
M
2
4
6
8
10
Noon
2
4
6
8
10
M
J
F
M
A
M
J
J
A
S
O
N
D
Months
A.M.
P.M.
(a)
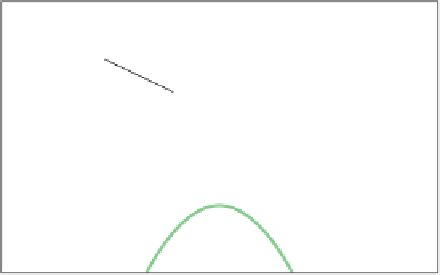
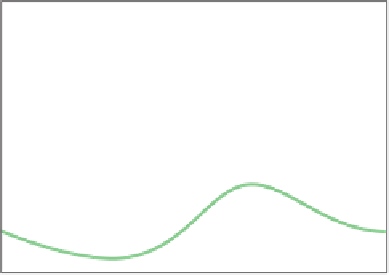
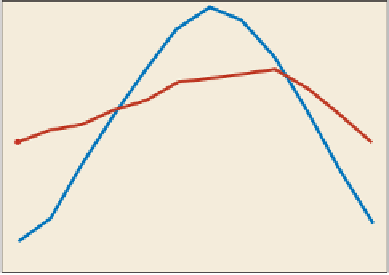
Figure 5.6 Annual temperature data from Topeka, Kansas,
and San Francisco, California.
A distinct peak in temperature
occurs in Topeka during the summer, whereas San Francisco is
comparatively moderate all year round.
70
60
June 21
50
Equinoxes
40
that influences temperature is the
maritime vs. continental
effect
. By definition,
maritime
places are located within
or near a very large body of water, such as San Francisco,
California, which is on the coast of the Pacific Ocean. In con-
trast,
continental
localities are surrounded by large landmasses,
such as Topeka, Kansas, which is on the eastern edge of the
Great Plains.
If you compare Topeka and San Francisco, observe that
the annual temperature curves vary significantly (Figure 5.6).
Notice that the San Francisco curve does not have a steep peak,
but rather changes gradually over the course of the year. In ad-
dition, the range between the high and low monthly tempera-
tures is narrow. At Topeka, in contrast, the curve has a much
higher peak with a more distinct change between seasons and
a greater overall range. This variability exists even though both
places are located at about the same latitude (38° N), which
would (correctly) lead you to believe that each locality receives
about the same amount of insolation.
30
December 21
20
10
0
-10
-20
M
2
4
6
8
10
Noon
2
4
6
8
10
M
A.M.
P.M.
(b)
30
80
25
70
20
60
15
50
10
5
40
0
30
-5
20
-10
10
Maritime vs. continental effect
The difference in annual
and daily temperature that exists between coastal locations and
those that are surrounded by large bodies of land.
-15
M
2
4
6
8
10
Noon
2
4
6
8
10
M
A.M.
P.M.
(c)
Maritime
A place that is close to a large body of water that
moderates temperature.
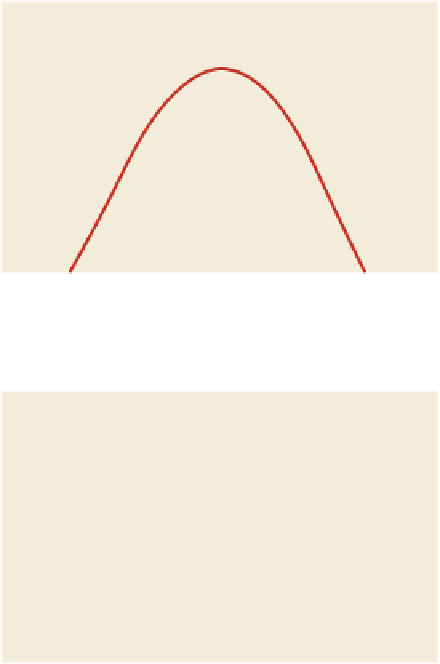
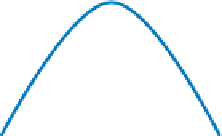
Figure 5.5 Interaction of (a) insolation, (b) net radiation, and
(c) air temperature.
These graphs show data taken at a midlati-
tude location in the Northern Hemisphere. Notice the close rela-
tionship among these three variables. Also note that a distinct lag
occurs with respect to the temperature response.
Continental
A place that is surrounded by a large body of
land and that experiences a large annual range of temperature.