Geoscience Reference
In-Depth Information
North
Pole
90
°
N
Energy deficit
at pole
Flow of energy
toward pole
23.5
°
N Tropic of Cancer
Incoming
energy
0
°
Equator
0
°
Outgoing
energy
23.5
°
S Tropic of Capricorn
Energy surplus at
equatorial/tropical
regions
Flow of energy
toward pole
Energy deficit
at pole
90
°
S
South
Pole
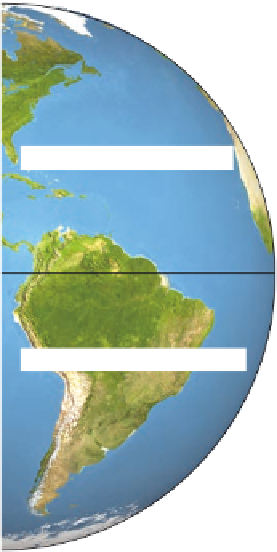
Figure 4.24 net radiation and the transfer of heat energy on Earth.
Compare this dia-
gram to Figure 4.23 and note where areas of net surpluses and deficits are found and how
energy flows on the planet.
How does this variation in net radiation between latitudes
influence natural processes on Earth? We will cover the signifi-
cance of this spatial relationship in greater detail later in the text,
but for now it is sufficient to say that the difference in net radia-
tion is a primary driving force behind many atmospheric circula-
tory processes, especially large-scale wind patterns. Figure 4.24
shows how this transfer works.
What happens to net radiation patterns when we add the ef-
fect of the seasons to the mix of variables? Recall that this sea-
sonal effect takes place because of the geometric relationship
between Earth and the Sun, which results in changes in the angle
of incidence over the course of the year. Remember, too, that at
any given point on Earth, the position of the Sun at solar noon
migrates over the course of the year because of axial tilt and or-
bital position. This seasonal migration of the Sun, in turn, causes
the subsolar point (on Earth) to change position with respect to
latitude. This shift of the subsolar point north and south of the
Equator has a major influence on the seasonal distribution of net
radiation, as you can see in Figure 4.25.
Figure 4.26 compares two curves of annual insolation by
latitude—one with Earth's actual axial tilt (23.5°) and the other
with the axis not tilted. With a tilted Earth, you can see that
annual radiation at low latitudes is about 40% greater than at
high latitudes, but that high latitudes still receive a considerable
amount. However, if the Earth's axis were perpendicular to the
plane of the ecliptic, annual radiation would range from a high
value at the Equator, where the Sun angle would consistently
be 90°, to
zero
at the poles, where the Sun would always be at
the horizon. You can see that axial tilt is an important variable
with respect to daily insolation at various latitudes, and that as
a result, the poles receive nearly half the amount of radiation
as the Equator, even though they are in darkness six months of
the year.
A good way to conclude this discussion about the global
radiation balance is to examine the effects when all the
variables—angle of incidence, latitude, seasonality, and length
of day—are considered together. Figure 4.27 graphically illus-
trates these combined effects on seasonal insolation at the top of
the atmosphere at three places: the Equator (0°), 45° N, and the
North Pole (90° N). Notice in this diagram that the North Pole
has the greatest annual range of daily insolation, with a distinct
peak at the Summer Solstice and no radiation received in win-
ter. The Equator, in contrast, receives consistently high amounts
of radiation all year. Given its location midway between the