Geoscience Reference
In-Depth Information
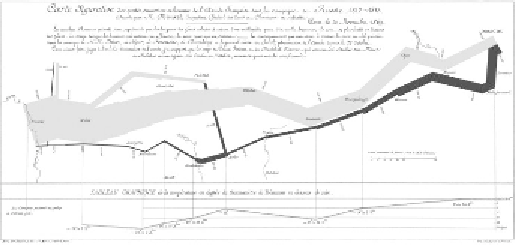
Figure 1.2.
“Figurative map of the successive losses in men of the French
Army during the Russian campaign in 1812-1813.” The map is a
topographic representation of the French Army's itinerary. The retreat is
shown in black; the temperature is shown in the lower section.
The work of Charles-Joseph Minard illustrates the growing
use of graphs and maps as logistics and management
technology. During his career as an engineer, Minard played
an important role in the expansion of the railway network in
France, from 1840 until his retirement in 1851. In his
opinion, maps facilitate the most rational judgment of the
usefulness of a given infrastructure, such as a post office in
Paris. In this respect, the map he made in 1846 combined
the demographic weight of Parisian districts, with the
“centers of gravity” of the population and the mail,
determined by theories of that time [PAL 96, p.132]. Due to
that map, Minard deduced the structure most appropriate to
the needs of the population. Far from being an
administrative tool, here the map came alongside a new type
of governance based on the visualization of data through
statistics. Nevertheless, Minard did not stop there: after his
retirement, he continued his activity as a cartographer by
researching ways of showing information with graphs. To
him, maps should “help the eye appreciate straightaway as
much as possible the numerical results” (Minard, cited by
[PAL 96, p.114]). He wanted to create maps as tools to
“calculate with the eye” [PAL 96, p.14] and developed
innovative graphic processes to do so, such as flow maps.
Search WWH ::

Custom Search