Geoscience Reference
In-Depth Information
2. Assessment of Regional Surface Temperature Trends
in the Indian Ocean/Southern Asia Region
Previous studies have documented a pronounced SST warming signal in the
Indian Ocean and western Pacific warm pool region over the past century
(Knutson et al., 1999; Karoly and Wu, 2005; Knutson et al., 2006; Xie et al.,
2010). Here we have reassessed this warming signal using: (i) data updated
through more recent years (through 2010); (ii) a recently updated combined
SST and land temperature data set from the UK Meteorological Office
(HadCRUT4); (iii) multi-model (CMIP5) estimates of internal variability and
the historical response to anthropogenic and natural radiative forcing changes
(~1860 to present); and (iv) analysis of individual seasons as well as annual
means. Further details of the methodology and an analysis of the internal
variability simulations are contained in Knutson et al. (2013).
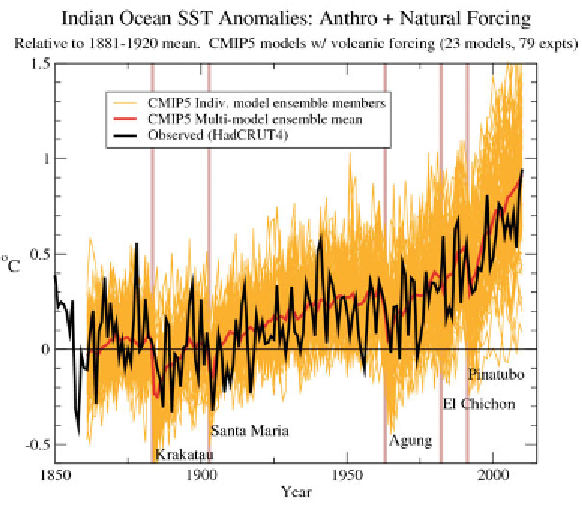
Figure 1 shows time series of observed and model-simulated SST for the
Indian Ocean region (north of 30
o
S). The orange and blue lines in the panels
depict individual model runs from All Forcing (orange) or Natural Forcing
Only (blue) historical runs of several CMIP5 models. “All Forcing“ refers to
runs that have both natural (e.g., solar variability, volcanic aerosols) and
anthropogenic (e.g., well-mixed greenhouse gases, ozone, anthropogenic
aerosols, and land use change) forcing agents. Dark red and dark blue lines in
Fig. 1 are multi-model ensemble means where each individual model is given
(a)
Search WWH ::

Custom Search