Geoscience Reference
In-Depth Information
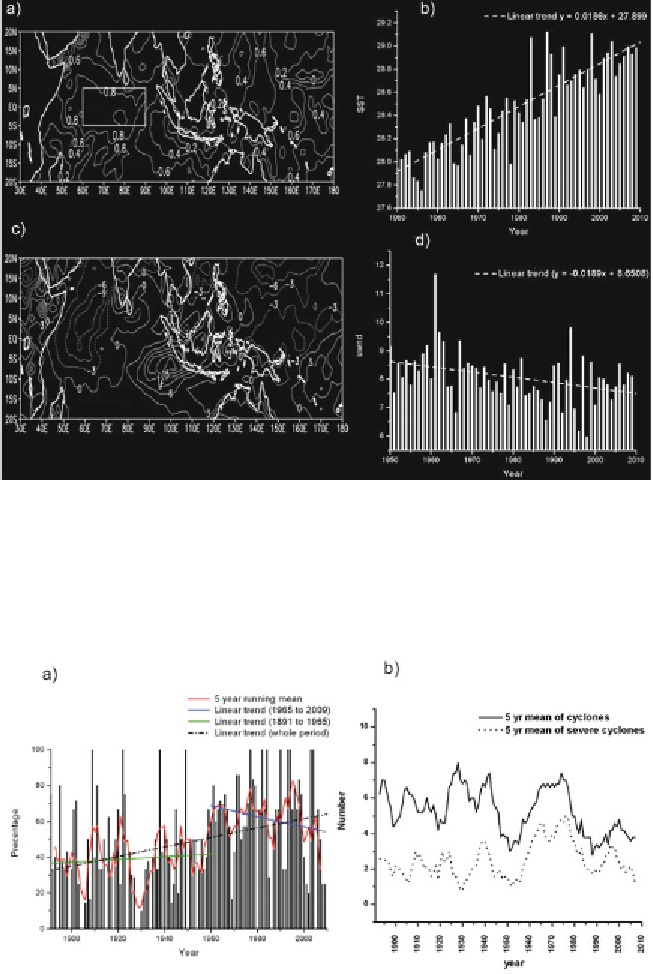
Fig. 3:
(a) Difference of June-Sept SST (2000-2009) minus (1950-1959). The area
used for SST is given by the rectangular box. (b) Jun-Sept SST averaged over
60-90°E, 5°S-5°N and linear trend. (c) Difference of June-Sept OLR (2003-2009) minus
(1979-1985). (d) Jun-Sept wind averaged over 10
o
N-20
o
N, 75
o
E-90
o
E and linear trend.
Fig. 4:
(a) The ratio of severe cyclones to cyclones. The linear trend from 1891 to
1965, 1965 to 2009 and 1891 to 2009 are also given. (b) Severe cyclones and cyclones
along with their 5-year moving average.
Search WWH ::

Custom Search