Geoscience Reference
In-Depth Information
warm core anomaly at 200 hPa (RT
a
), wind speed and MSLP as a function of
time for (a)
'Gonu'
and (b)
'Nargis'
cyclone, we can see the order of warm
core anomaly for
'gonu'
and
'nargis'
were around 11°C and 7°C respectively.
The warm core anomaly located at the central position of the
'Gonu'
and
'Nargis'
cyclone 20°N/64°E and 16°N/94°E respectively. The higher warm core anomaly
for '
Gonu'
may be due to the intensity of the super cyclone which was T 6.5
declared by IMD in comparison with very severe cyclone
'Nargis'
T 5.0. A
warm core temperature anomaly is indicative of the actual warm core of a
tropical system. As a storm intensifies, the warm core temperature anomaly
will increase, especially near the centre or eye of the storm (UW-CIMSS,
homepage
). During the development of the cyclone, the relatively warm and
moist inflow concentrates localized sensible heating in the eye and also
contributed to additional heating throughout the column; as the air ascends in
the eye wall further condensation results in the release of latent heat which
develops a warm core in the mid-upper of the cyclone.
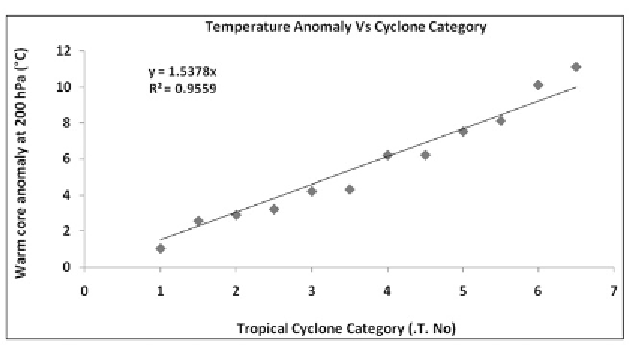
Finally, grouping the anomalies of both cyclones with cyclone intensity
(.T. No) during the cyclone period have been shown in Fig. 5. The figure gives
an indication of how well RT
a
can be categorized through the different warm
core intensities of the cyclone. As a cyclone intensifies, the warm core
temperature anomaly will increase which is the indication of the positive
relationship of cyclone intensities with a warm core anomaly. Earlier studies
have shown that the maximum temperature anomalies for severe cyclone over
the ocean region (Bay of Bengal and Arabian Sea) was reaching upto 7 to 8 ºC
at 200-300 hPa but no previous study has reported in case of super cyclone
'Gonu'
with intensity T 6.5 where the maximum anomaly reached up to 11°C.
The regression line indicates that for each 1.5°C rise in the RT
a
, the cyclone
advances in one category i.e. T. No. Although the categories are not large in
Fig. 5:
RTa anomaly with cyclone intensity. The red symbol in the figure indicates
the mean temperature anomaly in that category.
Search WWH ::

Custom Search