Geoscience Reference
In-Depth Information
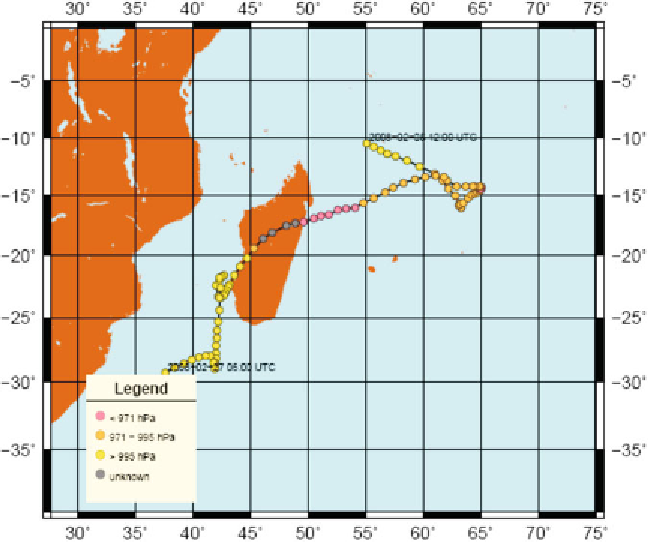
Fig. 5:
Best track of tropical cyclone
Ivan
.
Tropical Depression (i.e. estimated pressure is above 995 hPa) and solid line
connects the points when the storm attained Tropical Cyclone intensity (a
threshold of 995 hPa or below is selected for display purposes). Users can
obtain information about characteristics of the tropical cyclone at a particular
location by clicking on a dot point. As a result, the following information is
displayed: tropical cyclone name, geographical coordinates of the selected
position, time and intensity in terms of an estimated value of pressure in
hectopascals.
Other features of the website include displaying multiple tropical cyclone
tracks to satisfy users' requirements to present cyclone tracks over the whole
tropical cyclone season, or a number of seasons, and enabling a down-load
facility. Specifically, “Tropical Cyclone Track Details” feature allows users to
display tropical cyclone data for a selected cyclone (date and time, latitude and
longitude, and intensity in terms of central pressure) in a separate window. The
“Report on Specific Location” feature allows users to display tracks for cyclones
crossing within a specified distance (e.g. within a radius of 50, 100, 200 and
400 km) from a specified position. The specified position can be defined as a
point with specific geographical coordinates (e.g. 12.42°S 130.89°E) or as a
location selected from a list (e.g. Darwin).
Search WWH ::

Custom Search