Geoscience Reference
In-Depth Information
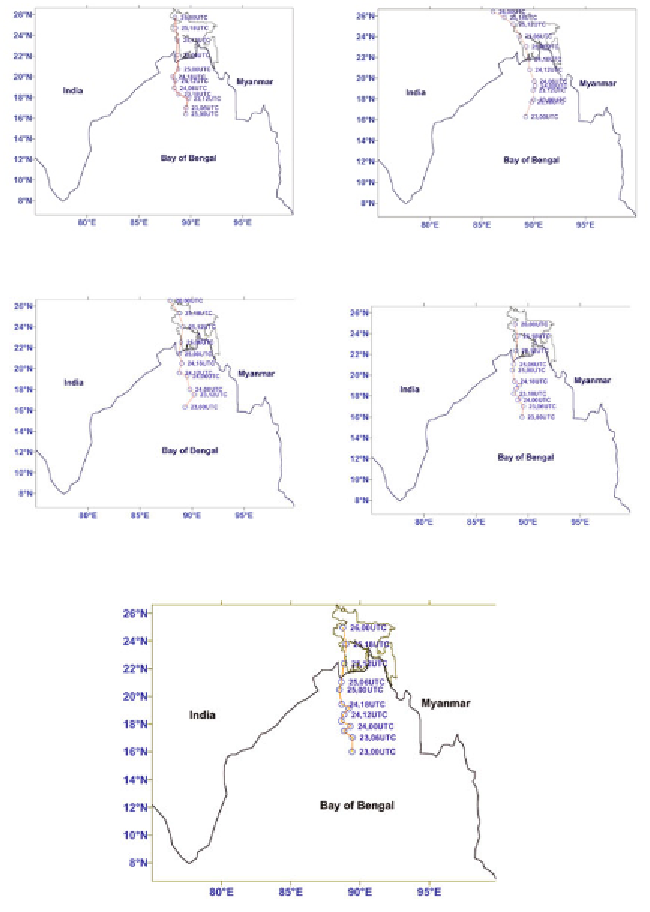
Fig. 4(a):
'Aila' track (KFFR).
Fig. 4(b):
'Aila' track (KFKS).
Fig. 4(c):
'Aila' track (KFLN).
Fig. 4(d):
'Aila' track (KFWSM3).
Fig. 4(e):
'Aila' track (KFWSM5).
reached considerably to 350 hPa, 250 hPa, 300 hPa, 300 hPa and 300 hPa
levels respectively for KFFR, KFKS, KFLN, KFWSM3 and KFWSM5 when
the maximum average vorticity was at 800 hPa level. The temporal variation
of average vorticity of observed levels are given in Fig. 5(a). The low level
vorticity around the system was in higher state when it was close to the coast
(Fig. 5(b-f)).
Search WWH ::

Custom Search