Geoscience Reference
In-Depth Information
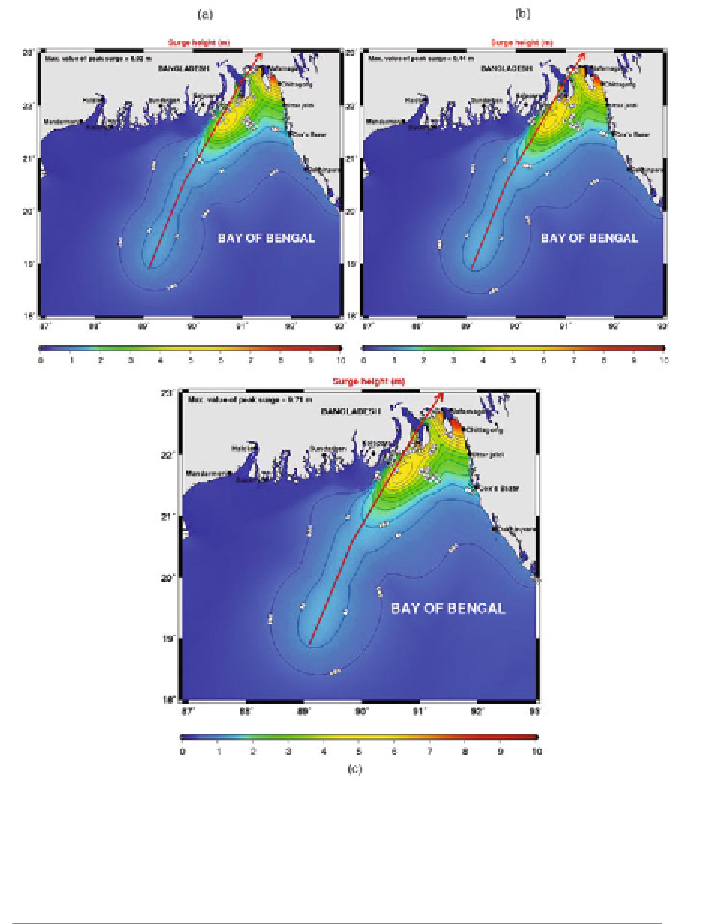
Fig. 6:
Peak surge envelope along Bangladesh coast computed with
(a) '
P
= 80 hPa, (b) '
P
= 86 hPa and (c) '
P
= 89 hPa.
Table 2:
Maximum storm surge amplitudes (m) for different regions and different
climate change scenarios
Regions
Amplitude (m)
Amplitude (m)
Amplitude (m)
No climate change
7% intensification
11% intensification
Gujarat
5.7
6.1 (6.0% increase)
6.3 (9.6% increase)
Tamil Nadu
3.3
3.5 (6.1% increase)
3.6 (8.5% increase)
Andhra Pradesh
6.2
6.5 (6.3% increase)
6.7 (9.1% increase)
Odisha
6.1
6.4 (5.6% increase)
6.6 (8.4% increase)
Bangladesh
8.9
9.4 (5.8% increase)
9.7 (8.9% increase)

Search WWH ::

Custom Search