Geoscience Reference
In-Depth Information
Recently, trends in activity of TCs in the SH (the region south of the equator,
30°E to 120°W) were estimated by Kuleshov et al. (2010a) analysing the data
from the SHTC archive. In that study, a TC is considered a tropical system
which attains minimum central pressure of 995 hPa or lower. The statistical
significance of trends was examined based on non-parametric Monte Carlo
methods and based on the test of whether a constant model, a linear model or
a simple break-point model represents a best fit to the data. The purpose of this
examination was to determine whether there are trends in the SH TC occurrence
and intensity time series beyond what can be attributed to inter-annual variability
and changes in observing procedure. The data set used is the SHTC archive
which was compiled from the best track data sets of the national meteorological
services with WMO responsibility for TC forecasts and warnings across the
SH, in consultation with these offices. A documentation of trends in this data
set thus provides baseline information for detection and attribution studies
towards projections of expected changes in TC activity under global warming.
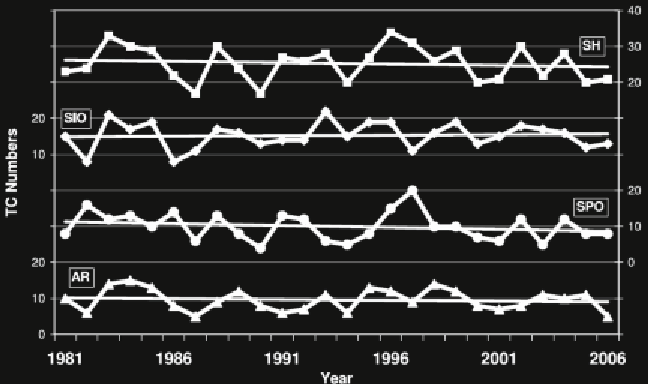
Changes in TC occurrences in the SH, the SIO (30°E to 135°E) and the
SPO (135°E to 120°W) and the Australian region (AR, 90°E to 160°E) were
analysed over the 26 seasons 1981-82 to 2006-07. Over this period, there are
no significant trends in the annual numbers of TCs (SPO, SIO, AR, SH) attaining
a lifetime mean central pressure (LMCP) of 995 hPa or lower (Fig. 1). The
statistical significance of the linear trends in the various TC time series was
assessed in two ways. Firstly, the statistical significances have been calculated
by Monte Carlo simulation (10,000 iterations) involving resampling the time
series
with
and
without
replacement and forming a sampling distribution of the
Fig. 1:
Annual numbers of TCs with LMCP of 995 hPa or lower for the SH (squares,
right axis), SIO (diamonds, left axis), SPO (circles, right axis) and AR (triangles, left
axis), 1981-82 to 2006-07 seasons, with linear trends.
Search WWH ::

Custom Search