Geoscience Reference
In-Depth Information
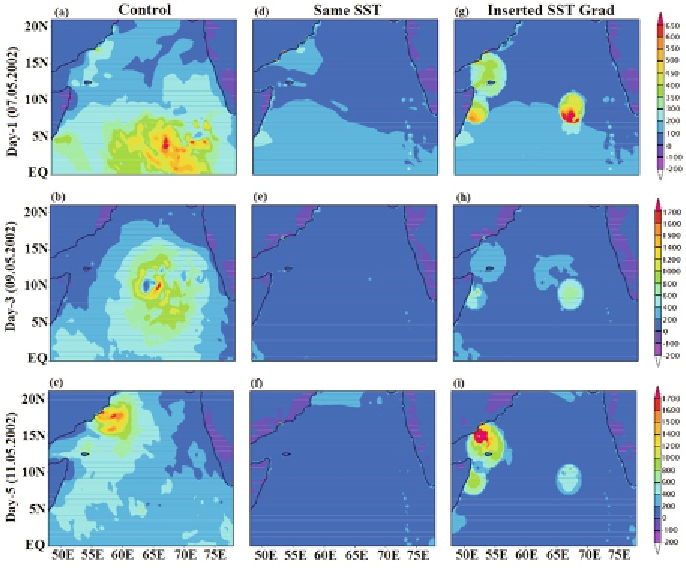
Fig. 5:
The latent heat flux (in W/m
2
) near surface obtained from model simulations
of (a) control, (d) same SST, and (g) Inserted SST grad for day-1; (b), (e) and (h) are
same as (a), (d) and (g) but for day-3; and (c), (f) and (i) are same as (a), (d) and
(g) but for day-5.
the model results are presented from the same time, while in JTWC, a very
weak low pressure is reported at 18 UTC of 5 May and prior to this time no
information is available. Therefore, the track of JTWC is shown from 00 UTC
of 6 May. It may be noted here that the same SST experiment could not be able
to generate a cyclonic storm even a low pressure system during the integration
period, therefore no track of the cyclone is found in this case. It is seen from
Fig. 6 that initial location of the storm is same in all the three experiments. It is
noticed from the observation that the movement of the cyclone is north-
northwest wards from 00 UTC 6 May to 00 UTC 7 May and then northwest
wards till the landfall. In the Control experiment, the movement of the cyclone
is south-north zigzag movement for the first two days and after day-2, the
movement is north-northwest wards. It is seen that the location of the cyclone
in Control is southwards till day-3 and northwards after day-3 when compared
to observed location. In the Inserted SST grad experiment, the cyclone remains
in the same position during 6 May and then moves northwest wards. It is seen
that the location of the cyclone in Inserted SST grad is always southwards as
Search WWH ::

Custom Search