Geoscience Reference
In-Depth Information
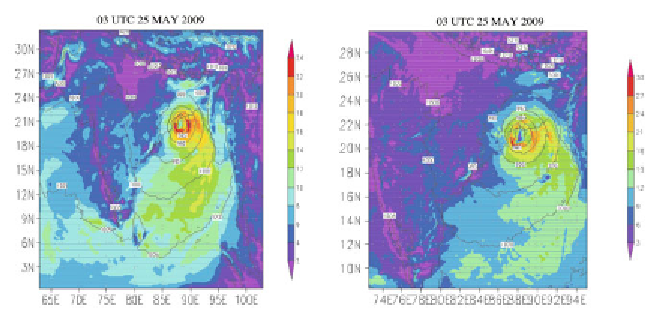
sea level pressure is 968 hPa.The maximum sustained wind speed is 30 m/s
with 27 km horizontal resolution and 28 m/s with 9 km horizontal resolution
while IMD observed maximum sustained wind speed is 31 m/s. Thus, the Model
under-predicted the mean sea level pressure compared to the IMD observations
for both 27 and 9 km horizontal resolution. The contours of sea level pressure
distribution at the mature stage of the two domains is shown in Fig. 3. According
to INSAT imageries (Fig. 4(a-f)
)
, a low level circulation developed over the
South Bay of Bengal at 0830 IST on 21st May 2009. It developed into a vortex
with centre 11.50 N and 85.50 E and intensified at 1730 IST on the same day.
It further intensified into a depression with centre 16.5 N and 88.0 E at 1130
IST of 23
rd
May. Figure 4 (a-e) shows the INSAT imagery of the storm at
different stages of the cyclonic storm Aila.
Figures 5(a) and 5(b) show the Radius-Height cross-section of zonal wind
(m/s), meridional wind (m/s) and vertical velocity (m/s) of 27 and 9 km
resolution. The wind distribution of the cyclone with 27 km resolution is shown
in Fig 5(a). Zonal wind shows an inflow of 10 m/s extending up to 910 hPa and
an outflow of 5 m/s in the western sector of the storm. The meridional wind
shows the maximum wind of 35 m/s extending up to 950 hPa and 30 m/s
extending from 950 to 800 hPa in the western sector of the storm. The vertical
wind shows the ascending motion of 0.7 m/s at 350 hPa and descending motion
of 0.2 m/s at height of 300 hPa. The wind distribution of the cyclone with 9 km
resolution is shown in Fig. 5(b). The zonal wind shows the inflow of 15 m/s
extending up to 910 hPa and outflow is 20 m/s in the western sector of the
storm. The meridional wind shows the maximum wind of 30 m/s extending up
to 400 hPa and 30 m/s extending from 950-800 hPa in the western sector of the
storm. The vertical wind shows an ascending motion of 3.7 m/s extending
from 700-500 hPa and 2.5 m/s at 250 hPa. For both the resolutions the
Fig. 3(a) & (b):
Winds (m/s) at 10 m level and mean sea level pressure of 972 hPa
at mature stage with 27 km and 9 km horizontal resolution.
Search WWH ::

Custom Search