Geoscience Reference
In-Depth Information
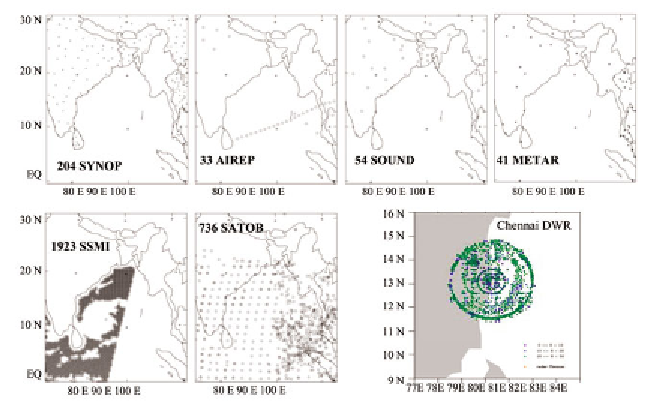
Fig. 5:
Data distribution (of SYNOP, AIREP, SOUND, METAR, QSCAT, SSMI
and Chennai DWR respectively) for TC Jal at 00 UTC 6 Nov 2010.
forecast intervals (72-60 hours). The gain in skill of the DWR experiment
ranges from 33% to 74% from the 12 to 72-hour forecast, while it is from 5%
to 28% in the case of the GTS data. The skill of DWR over GTS varies from
30% to 60% from the 12-hour to 72-hour forecast.
The impact of DWR data on different stages of the cyclone (prior and after
landfall) shows significant improvement in changes in the vertical profiles of
wind and relative humidity in the boundary layer (below 700 hPa level) and
upper levels of the atmosphere (200 hPa level). However, there is no such
change in temperature. The vertical cross-section of hydrometeors, horizontal
wind, vertical velocity, and equivalent potential temperature also suggests the
better performance of DWR data assimilation experiments. Ultimately, this
resulted in a realistic simulation of inner core structure and a better prediction
of lower-level vorticity, upper-level divergence, and steering flow in the DWR
experiment. Therefore, the DWR experiment could predict more realistic
movement and intensity of the system. Still, the DWR experiment also fails to
predict intensity changes such as the maximum intensity of Sidr (944 hPa and
59 m s
-1
), dissipating over the sea itself before landfall (Jal) which needs further
investigation. Improvements are needed in the inland rainfall and intensity
changes although overall, 24-hour accumulated rainfall is well predicted by
the DWR assimilation.
3.4 NMM Model Performance on Simulation of TCs over NIO
In this section, the performance of the NMM model is evaluated in simulation
of BoB cyclones Sidr (11-16 Nov 2007) and Nargis (27 April-3 May 2008)
Search WWH ::

Custom Search