Geoscience Reference
In-Depth Information
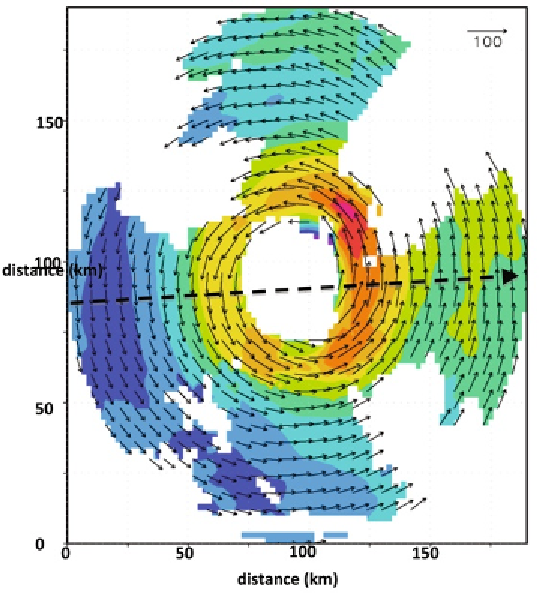
Fig. 7:
Airborne Doppler-analyzed horizontal wind field at 2-km altitude in Hurricane
Katrina, 28 September 2005. Color denotes wind speed (m s
-1
) and the arrow denotes
the wind direction. Flight track of the aircraft is denoted by the dashed black line.
Fig. 1 to document the outwardly sloping tangential wind maximum comprising
the primary circulation; deep low-level inflow, outflow above 10 km, and rising
motion in the eyewall sloping outward with height, characterized the secondary
circulation (e.g., Fig. 8). Convective-scale up and downdrafts within the eyewall
were inferred using Doppler measurements at vertical incidence after the
removal of aircraft vertical motion and estimated particle fall speeds. With the
analysis, particle trajectories could be followed throughout the circulation to
describe the TC water budget. They concluded that this organized structure
makes the TC more predictable than other tropical convective systems and
allows for accurate numerical modelling of TCs. Marks et al. (1992) refined
and extended this analysis, deriving vertical motion from mass continuity, and
providing the first complete documentation of the three-dimensional TC core
wind field at 10-25-km radial distance and 1-km scales in the horizontal and
vertical, respectively. Asymmetries in the radial wind that varied with height
were described for the first time, and these asymmetries were shown to
contribute to the manner in which different air masses entered and exited the
vortex and thus aided in intensity change.
Search WWH ::

Custom Search