Geoscience Reference
In-Depth Information
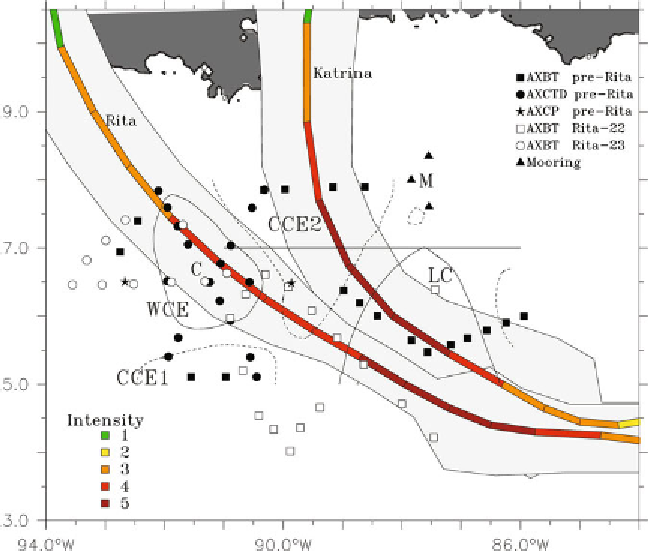
Fig. 4:
Airborne profilers deployed in September 2005 relative to the track and intensity
of Hurricanes Katrina and Rita (coloured lines, with colour indicating intensity as per
the legend) over the LC system. The light gray shading on the sides of the storm tracks
represents two times the radius of maximum wind. The contours are envelopes of
anticyclonic (solid: WCE and LC) and cyclonic (dashed: CCE1 and CCE2) circulations.
A set of AXBTs was deployed after Hurricane Rita (26 September), following a sampling
pattern similar to pre-Rita (or post-Katrina on 15 September).
During the storm, they remained neutrally buoyant, following the three-
dimensional motion of water parcels in the highly turbulent upper boundary
layer. They measured temperature, salinity, and gas concentration. The SOLO
floats profiled temperature, salinity, and oxygen from the surface to
approximately 200 m (Fig. 5, blue line) while hovering at about 40 m for a
period of time during each dive interval to remotely measure surface waves
and the depth of the bubble layer created by surface wave breaking, using a
compact sonar and 0-50-kHz ambient sound with a passive hydrophone. The
floats were programmed to repeat its dive interval every four hours.
Black (1983) showed that, of 19 TCs, those over an oceanic mixed layer
depth (MLD) <50 m produced crescent-shaped decreases of as much as a few
kelvin in the sea surface temperature. The cooling was concentrated in the
right rear quadrant (relative to motion in the Northern Hemisphere), with the
maximum occurring a short distance outside the eyewall. This implies that
Search WWH ::

Custom Search