Geoscience Reference
In-Depth Information
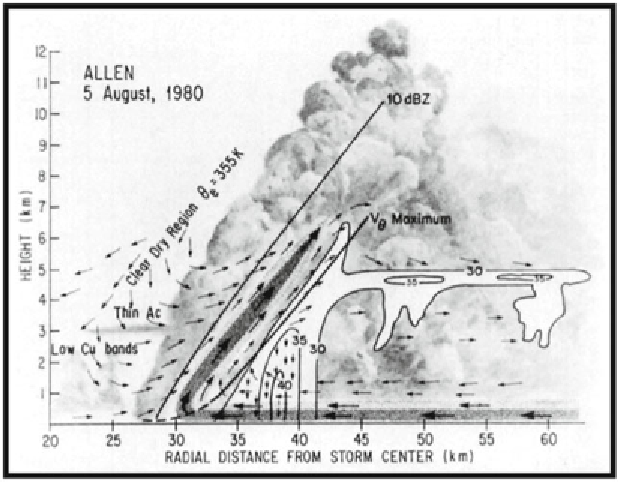
Fig. 1:
Schematic cross section depicting the locations of the clouds and precipitation,
radius of maximum wind, and radial-vertical airflow through the eyewall of Hurricane
Allen on 5 August 1980, from Jorgensen (1984b). The downward motion in the eye
was based on estimates of radial divergence, and the downdrafts within the high rainfall
rate region were inferred from vertical velocity time series from the individual passes.
Reflectivity (dBZ) contours were based on a composite using 15 passes, although there
was considerable pass-to-pass variability. The slope of the clouds on the inside edge
of the eyewall was based on radar minimum detectable signal analysis, aircraft
altimeter readings, photography and observer notes. Dark shading denotes the location
of the largest radial and vertical velocities.
3. Airborne Expendables
3.1 GPS Dropwindsondes
As a TC approaches land, successful evacuations and damage mitigation
measures, based on accurate forecasts, can reduce property damage and loss of
lives. In 1982, TC numerical modelling was in its infancy, and the best track
guidance available to forecasters was statistical. However, to help provide
improved synoptic analyses and numerical forecasts to optimize warning areas
and increase warning lead times, HRD began to test the hypothesis that
additional vertical wind and thermodynamic profiles in the TC environment
(the “synoptic flow”) would provide improved operational guidance to human
forecasters (e.g., Fig. 2).
The data obtained during the 19 P-3 research missions conducted for this
purpose through 1996 helped to reduce errors in TC track forecasts significantly
Search WWH ::

Custom Search