Geoscience Reference
In-Depth Information
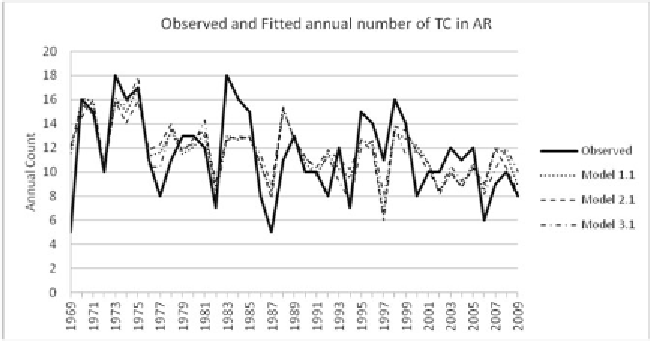
Using the developed models, the modelled annual number of TCs in the
Australian region was compared with the observed (Fig. 5).
Using the developed models, forecast of a number of TCs in the Australian
region in 2010/11 was prepared (Table 4), with the standard error (SE) of the
forecast given in brackets. The predicted number averaged over the three models
is 14, which is higher than the observed number of 11 cyclones; however the
models demonstrate improvement in prediction skill compared to the statistical
models currently used by the NCC which predicted 20 to 22 cyclones.
Table 4:
Forecasts of the number of TCs occurring in the Australian region in 2010/
11 and 2011-12 prepared using the developed models
Model 1.1
Model 2.1
Model 3.1
Average
2010-11 Forecast (SE)
14.34 (1.29)
13.47 (1.25)
14.54 (1.28)
14.12
2011-12 Forecast (SE)
11.82 (0.96)
11.26 (0.96)
11.65 (0.92)
11.58
The forecast for the number of TCs in 2011-12 was also prepared using
the three models. The numbers are similar for all three models and they indicate
that the predicted TC activity in the Australian region for 2011-12 cyclone
season—12 cyclones averaged over the three models—is expected to be similar
to the long-term average of 12 cyclones.
Regression analysis for the eastern South Pacific Ocean and the western
South Indian Ocean was also performed. Correlation between a number of
TCs in the regions and the ENSO indices was calculated for the 1-, 2- and 3-
months average. For each index, the month (months) with the highest correlation
with the number of TCs in the region were selected. It was found that the
correlations were not as strong as in the Australian region. For example, in the
Fig. 5
: Time series of the total annual number of TCs in the Australian region as
observed (solid line) and predicted using the 5VAR index+Time (Model 1.1), NIÑO3.4
index+Time (Model 2.1) and the SOI index+Time (Model 3.1).


Search WWH ::

Custom Search