Geoscience Reference
In-Depth Information
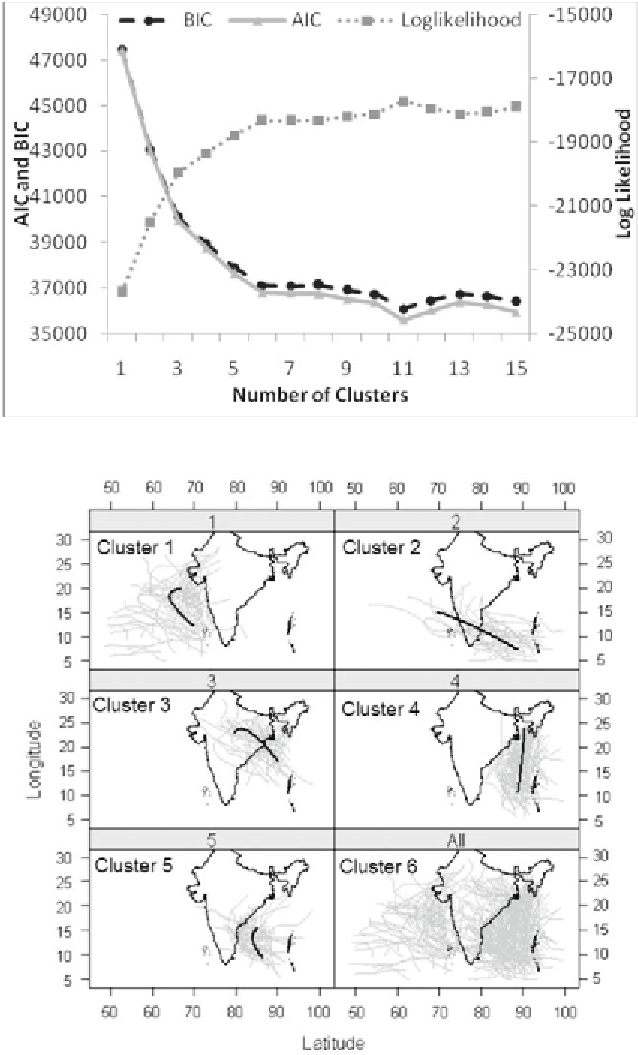
Fig. 1:
AIC, BIC and Likelihood values for different number of clusters.
Fig. 2:
Trajectories in each of the five clusters with mean trajectories overlaid
(shown in bold) and all the tracks in North Indian Ocean during 1961-2010.
Search WWH ::

Custom Search