Geoscience Reference
In-Depth Information
late Tom Schopf, told Sepkoski that he was up for tenure considera-
tion that year. Such an announcement, like the discovery that one is
to be hanged in a fortnight, "concentrates [the] mind wonderfully."
3
In a "panic to publish quickly, the young professor decided that his
best bet was to try to get out an article based on his compendium.
Sepkoski worked frantically for months, only to have Schopf return
to say that he had been mistaken—Sepkoski's tenure would be
decided the
following
year. But by this time Sepkoski had gone too far
to turn back.
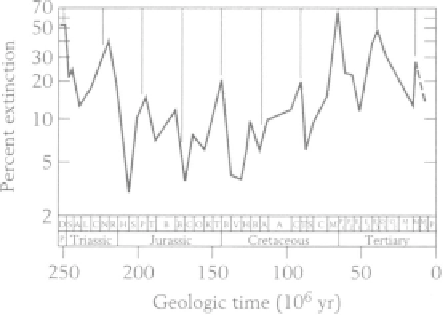
Raup had the idea that instead of merely perusing the compen-
dium (a task sufficiently boring as to cause even a quantitatively
minded paleontologist to nod off) it might be examined with the
aid of a computer to see whether any interesting patterns emerged.
Raup and Sepkoski viewed an assortment of graphical computer
plots, even standing across the room to see whether a pattern recog-
nizable only as a "gestalt" would emerge. Sepkoski suggested that it
might be interesting to compute how the rate of extinction had var-
ied through time. A few days later, Raup brought the new plot,
shown in Figure 25, into Sepkoski's office. "Do you see it?" he asked,
"They're regularly spaced in time."
4
Raup had culled Sepkoski's data in the following ways: He had
examined only the most recent 250 million years, when geologic ages
are more precisely known; he had removed families whose ranges or
identity were poorly known; and, since we have no way of knowing
how long they may live, he deleted families that have not yet become
extinct. He divided the 250 million years up into the 39 stratigraphic
stages that geologists have recognized (geologists divide time into
eons, eras, and periods; rock units into systems, series, and stages—the
FIGURE 2 5
Raup and
Sepkoski's 1984 plot of
extinction periodicity.
5
The
best-fit cycle, at 26 million
years, is shown by vertical
lines.