Geoscience Reference
In-Depth Information
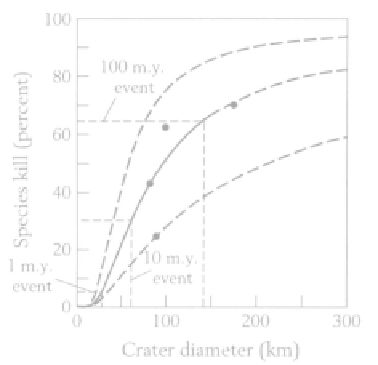
FIGURE 24
The impact-kill curve,
combining Raup's kill curve (Figure
23) and Shoemaker's estimates of the
frequency of formation of craters of
differing sizes (Table 5). The four
sites listed in Table 6 are plotted,
though only Chicxulub is confirmed.
[After Raup.
22
]
it reaches the point corresponding to a crater of around 45 km in
diameter, when it must begin to rise steeply. This could be the case,
for example, if a certain critical impactor mass were required before
extinctions become global and massive.
The stage, the smallest unit into which geologists subdivide the
rocks of the geologic column, represents a fundamental subdivision
of earth history. In the 600 million years since the Cambrian began,
Sepkoski identifies 84 stratigraphic intervals, most of them stages,
giving an average duration for a stage of approximately 7 million
years. If impact causes all extinction, as Raup rashly considered, then
craters large enough to be associated with extinction ought to have
about the same waiting time as the duration of an average stage. Is
that the case? To find the answer, inspect Table 5: Note that 7 mil-
lion years is the mean waiting time for a crater just over 50 km in
diameter. A crater of that size releases about 5 million megatons of
energy, roughly 50 million times the power of the atomic bomb that
TABLE 6
Candidate Craters for the Impact-Kill Curve
Percentage of
Crater
Size (km)
species killed
Puchezh-Katunki
80
43
Chesapeake Bay
85
25
Manicouagan
100
62
Chicxulub
175
70