Geoscience Reference
In-Depth Information
(a)
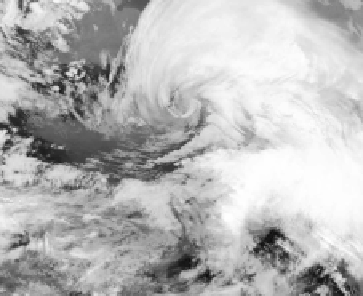
(b)
Figure 3.4.
Some examples of images produced by orbiting satellites. a) A TRMM image:
monthly analysis of predicted rainfall (in millimeters) for the month of June 2006.
Spatial resolution: 0.25°. b) A NOAA-15 AVHRR image from the December 26,
1999 at 08:00 GMT in thermal infrared (channel 4). The cold surfaces are the
areas in white and the warm surfaces are the areas in black. Resolution: 1.1 km
The use of satellites increases the quality of forecasting on a global level. Maps
that show the location of climatological stations all over the world (only one-tenth
of the entire world is well-known with this global network) are also used to provide
information about inhospitable areas and about regions where it is very difficult or
sometimes dangerous to obtain information. These areas include oceans, deserts,
high latitudes and altitudes, and areas in which there are lots of cyclones. Satellites
produce data over a short period of time and at a low cost. The frequency of the
observations carried out is important for meteorological phenomena that last for a
short period of time (a few hours for a storm, a few days for a depression), and for
phenomena that occur over a wide surface area. The data collected by the satellites
are much more homogenous than the data collected on the ground because there is
no frontier effect. The data can be used in both digital and spatialized formats. The
frequency of radiometer scanning leads to the creation of a grid of measurement
points that are evenly distributed over the Earth's surface and which can be easily
used in GIS software. The fact that there are different measurement points makes it
easier to create a map of the different climate variables. However, it would be a
mistake to think that this type of data could replace on-site measurements, because