Geoscience Reference
In-Depth Information
- data relating to heavy rainfall amounts that occurred during the month of April
1986 will also be used.
The spatial variation of these three sets of data (monthly averages between 1971
and 2000, monthly averages for 1986, and days of rainfall in April 1986) will be
explained by the three independent variables of altitude, slope, and topographic
roughness.
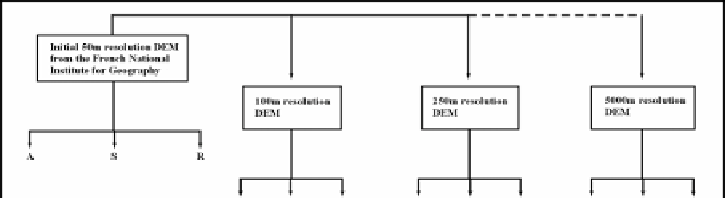
Figure 2.20.
50, 100, 250, and 5,000 m resolution derived DEM and
derived information layers
2.4.4.2.
Estimating total monthly rainfall (1971-2000 normal)
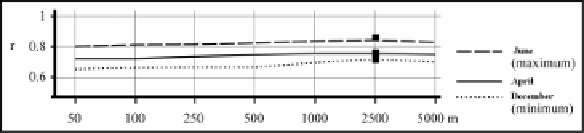
Figure 2.21.
Correlation coefficients for altitude/rainfall amount (monthly averages);
the altitudes are generated by seven DEMs, each with a different resolution
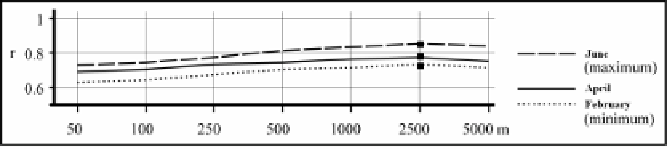
Figure 2.22.
Correlation coefficients for slope/rainfall amount (monthly averages);
the slopes are generated by seven DEMs, each with a different resolution