Geoscience Reference
In-Depth Information
The coefficients generated for these four cities were much lower in comparison
to the coefficients produced for Paris, which means that the urban island is more
powerful in Paris than anywhere else in France. The city of Lyon was the only city
that produced quite high values.
In the other three major cities the spatial temperature variation is only slightly
dependent on, or did not dependent at all on, the distance to the town center. Nice
and Bordeaux, which are not dealt with here, produced the same results. Regarding
Château-Thierry, the inverse happens, i.e. the temperatures in the periphery are
higher than the temperatures in the town center.
Figure 2.17 confirms and represents all of the values that can be seen in Table
2.3 in the form of a graph. The different spatial temperature variations show that
distance to the town center is not the only variable that dictates this change in
temperature.
Paris
Lyon
Marseille
Toulouse
Château-Thierry
r February
-0.59
-0.45
-0.05
-0.18
0
r August
-0.63
-0.55
+0.05
-0.21
+0.06
Table 2.3.
Correlation coefficients for temperature/distance from the town center taken
from four major cities in France for the months of February and August
As more knowledge is available on how land cover influences temperature, it
would be best to analyze how land cover affects the spatial variation in temperature
in addition to how distance from the town center affects it.
2.4.3.1.
Vegetation index
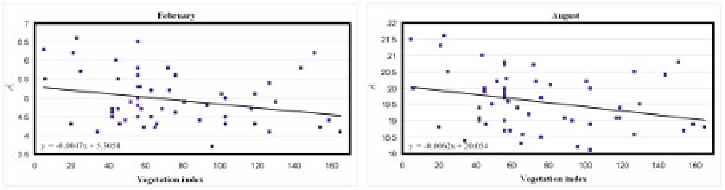
Figure 2.18.
Temperature variation in the region of Paris for
February, according to the variable vegetation index
The variable land cover is then introduced into correlation calculations by using
the vegetation index estimation (see section 2.3.2.3). The index used corresponds to
the average of 9 pixels taken from a 3×3 window located at each climatological
station. This variable, which explains the average physical state of the surface that
surrounds each station, also has a strong influence on the spatial temperature
variation. Weak indexes (mineral surfaces) are associated with higher temperatures