Geoscience Reference
In-Depth Information
variable) is -0.59 and -0.63, respectively for the 2 months in question. A
representation of this information can be seen in Figure 2.16.
As far as the city of Paris is concerned, there is no doubt that temperature
decreases as the distance to the city center increases, and this is true up to a distance
of at least 37 km from the center. This distance of 37 km corresponds to the vertex,
which is a disguise for the variogram.
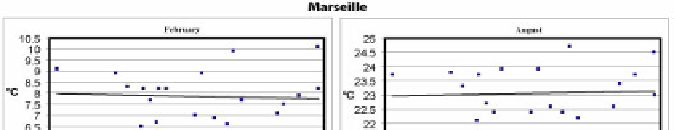
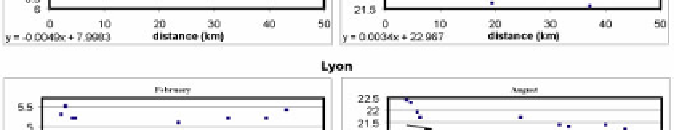
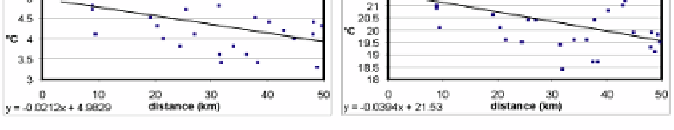
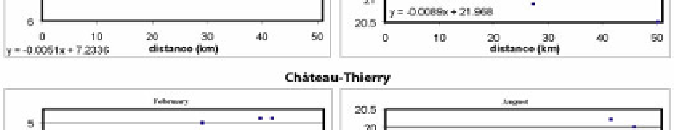
What happens at the other major cities in France that are smaller than Paris? The
same test was applied to four other major cities, and in their surrounding areas (at
least 50 km from their respective centers) where there was a sufficient number of
climatological stations present to allow the tests to be carried out.
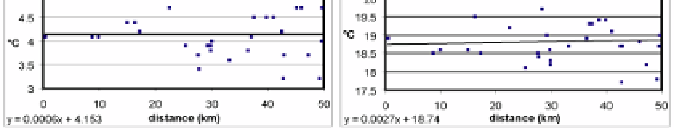
Figure 2.17.
Temperature variation around four major cities in France for Febraury and
August according to the variable “distance from the town center”