Geoscience Reference
In-Depth Information
mineral surfaces each group is made up of. Even if the values are allocated
empirically, they still reflect the trend followed by these areas composed of artificial
surfaces as far as heat is concerned. The complex zones are the most difficult areas
to quantify because all of the elements making up these zones are heterogenous. The
value of -10 allocated to this type of zone underlines this fact.
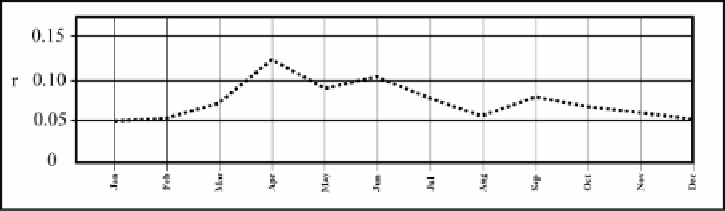
Figure 2.13.
Correlation coefficients between quantitative index values calculated
from the CLC and the average temperature for each month of the year
The final phase involves replacing the qualitative value, which shows that a
climatological station belongs to one particular CLC land cover type, with an index
quantitative value, similar to those developed in the previous paragraph. We now
have a model that can be used to highlight the importance of vegetation in space.
This new layer of information, which is understood to be the substitute to the NDVI,
can be integrated and used in correlation analyses with the aim of estimating how
temperature functions in space. Figure 2.13 shows the result of such an analysis that
was carried out in France.
The coefficient value is low and this can be explained by several reasons:
- The vegetation index value is produced by CLC, a large-scale representation
which is not perfect. Is the CLC really adapted to the issue to be resolved? It is
possible that the spatial temperature variation (determined by land cover) is carried
out on a small scale; a scale that is much smaller than the one provided by the CLC.
- The statistics can also be affected by conflicting constraints, that are spatial in
nature. France is a large country and can have several biogeographic systems. Each
biogeographic system functions independently, if not autonomously. The processes
that lead to the spatial variation of the different climatic factors that are to be
analyzed (such as temperature) can vary from one region to another. These
differences can be found in independent spatial factors such as the estimation of
biomass. These spatial factors are different spatially, but statistically they produce a
general model that is quite confusing.
A certain coherent temporal variation of the index is observed. The maximum
value occurs at the end of spring and at the start of summer, and the minimum
values (approximately 0.05) occur in winter and (quite oddly) in August. In order to
clarify the quality of this index, the values for France were compared with the
NDVI for the French region of Franche-Comté.