Geoscience Reference
In-Depth Information
nature. Variograms have ranges that exist in a ratio of 1:2 for angles of both 5° and
95°.
Vari og ram
γ
(h)
300
250
200
150
100
50
0
0
20
40
60
80
100
120
140
160
180
200
Dis tance h (in km)
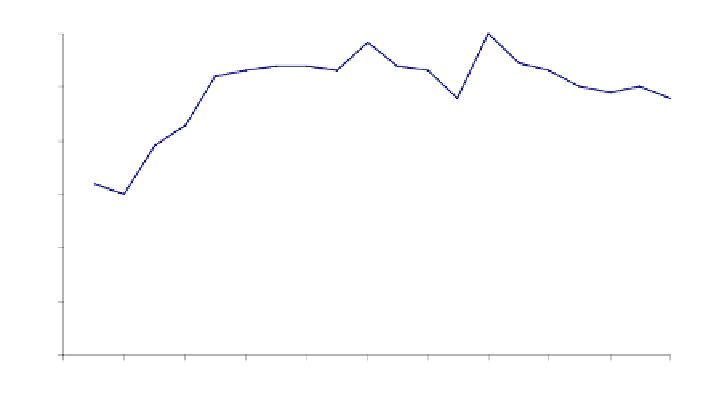
Figure 7.8.
Variogram of the residual rainfall for the month of December, flowing in a
North-South direction at an angle of 95°
Surprisingly, a nugget effect of 80 mm
2
exists for the month of December. This
can be quite easily explained because the median values are only estimations taken
from a reduced sample of rain gauges (of between 20 and 30 years).
For a common rain gauge whose true median rainfall is 45 mm (
P
=6.7 and
σ =3.1) the median's variance of estimation increases to 75 mm
2
and this is due
to the fact that only a sample of 25 years were used. A local variance, which is the
same size as the nugget effect (in other words 80 mm
2
) also exists for the entire
zone that is being studied. The interpolation method of kriging is applied to the
regression residuals on a monthly basis. This grid of residuals is then added to the
initial map drawn up to show the estimations of rainfall levels. These estimations
were made according to the geographical information that was available. As a result
it is, therefore, possible to create the final map showing the median rainfall level for
the month of December.
As can be seen in Figure 7.9, 12 different maps are created for a particular
month and they show monthly median rainfall levels. The maps were created by
taking geographical information into consideration, and by respecting the
hypotheses that were developed to create the different kriging equations.