Geoscience Reference
In-Depth Information
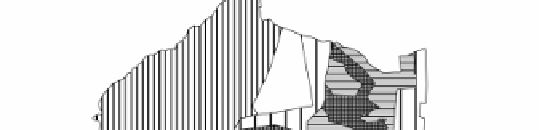
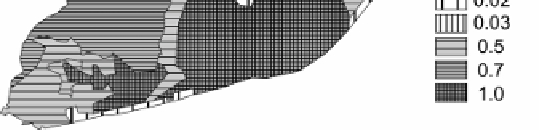
Figure 5.8.
Roughness length (z
0
) in Lisbon computed for the 1980s, which
served as input to the WAsP program [LOP 03; LOP SUB]
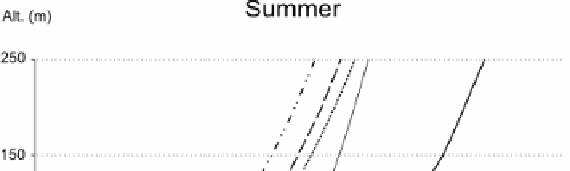
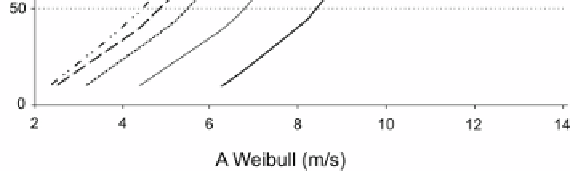
Figure 5.9.
Wind profiles in Lisbon for all wind directions simulated by WAsP [LOP 03]: a=
simulation of wind profile over the site of Lisbon, excluding the roughness caused by
urbanization; b=wind profile taking into account roughness caused by buildings in the 1980s;
c=wind profile for “Baixa”, southwards from Restauradores (R in Figure 5.4b) for the
1980s; d=projection of wind profile for Baixa considering z
0
increasing to 1.5 m in the
northern part of Lisbon; e=the same considering z
0
increasing to 2 m in the northern part of
Lisbon