Geoscience Reference
In-Depth Information
The following maps illustrate the data coverage of some types of these
observations, for a typical synoptic time of observation (Figures 4.7 to 4.16).
(http://www.ecmwf.int/products/forecasts/d/charts/monitoring/coverage/dcover/).
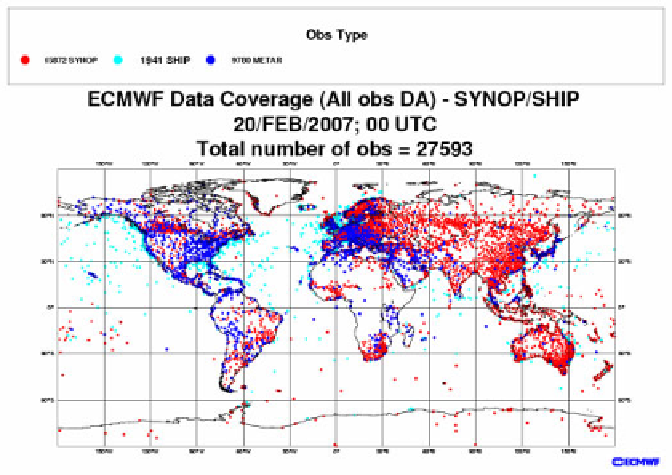
Figure 4.7.
SYNOP data used in the ECMWF analysis of 20/02/2007
at 00 UTC (see color section)
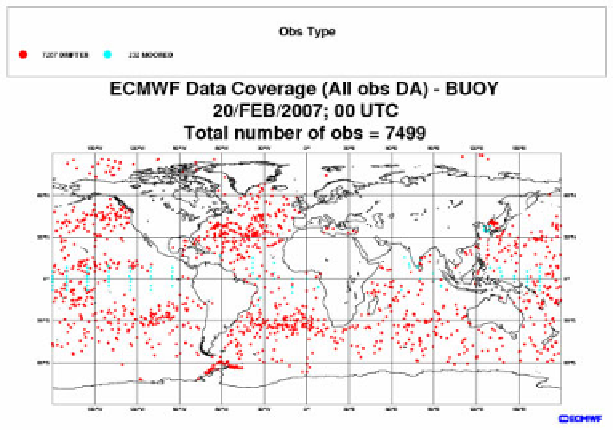
Figure 4.8.
BUOY data used in the ECMWF analysis of 20/02/2007
at 00 UTC (see color section)