Geoscience Reference
In-Depth Information
7000
(a)
Qtz
Northern
hillslope
6000
5000
4000
3000
Qtz
2000
An
QtzQtz
Qtz
Qtz
An
Qtz
0-15 cm
1000
15-70 cm
70-110 cm
0
110- cm
5000
Qtz
(b)
Riparian
zone
4000
3000
2000
Qtz
An
An
Qtz
Qtz
Qtz
Gbs
Qtz
Qtz
1000
0-20 cm
20-40 cm
40-60 cm
0
60-80 cm
4000
Qtz
(c)
Southern
hillslope
3500
3000
2500
2000
Qtz
Qtz
An
Qtz
Qtz
1500
Gbs
Qtz
Qtz
An
Qtz
1000
0-35 cm
35-65 cm
500
65-95 cm
0
95- cm
0
5
10 15 20 25 30 35 40 45 50 55 60 65 70 75
2θ (
o
)
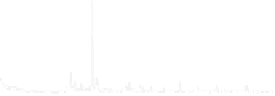
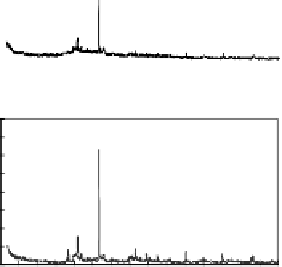
Fig. 3. X-ray diffractograms for primary minerals in (a) northern hillslope, (b) riparian
zone, and (c) southern hillslope. Qtz: quartz; An: anorthite; Gbs: gibbsite.
There was positive correlation with good agreement (
R
2
=0
.
85) between
the relative contribution of NSR to runoff generation and the change of
the stream Ca
2+
concentration during storm event on August 21-22, 2001
(Fig. 4(a)). Stream Ca
2+
concentration increased with the increase NSR
contribution to runoff generation. The mixing diagram (Fig. 4(b)) shows
that the stream chemistry was bounded by those three end-members.
Stream Ca
2+
concentration was much similar to that of the NSR water
at base flow condition then changed toward HSW when the storm started
and progressively changed toward peak storm until the end of storm and
returning to the value for NSR at the post storm. This suggests that Ca
2+
in the NSR transported to the stream channel by the lateral flow. During
this large storm, about 5.5 mg Ca
2+
/ha/day (or 0.002 kg Ca
2+
/ha/year)
has been leached out from the NSR.
In contrast, the higher concentration of Ca
2+
in the top 20 cm of soil,
compared with the deeper layer, was not in positive correlation with that