Geoscience Reference
In-Depth Information
[meq/l]
500
400
300
5 cm
10 cm
15 cm
20 cm
25 cm
30 cm
200
100
0
0
10
20
30
40
50
60
TIME [day]
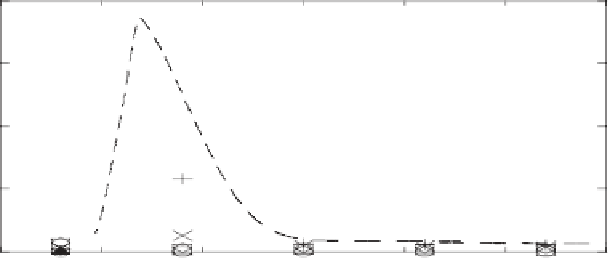
Fig. 3.
Time series of iron hydroxide in biophase.
[meq/l]
20
5 cm
10 cm
15 cm
20 cm
25 cm
30 cm
15
10
5
0
0
10
20
30
40
50
60
TIME [day]
Fig. 4.
Time series of divalent iron in biophase.
The concentration of divalent iron in both biophase and mobile phase
reaches a peak at about the 13th day. At this time, the concentration of
bacteria X3 also reaches a peak, organic carbon is almost consumed out. In
Fig. 3, it seems that all the concentrations of iron hydroxides in biophase
along any depth approaches with each other for the first 8 days, while for
the subsequent time the slightly deviation took place in the lower layer.
This is because that solute organic carbon in the upper layer is transported
downward and stored into the lower layer. As a result, organic carbon and