Geoscience Reference
In-Depth Information
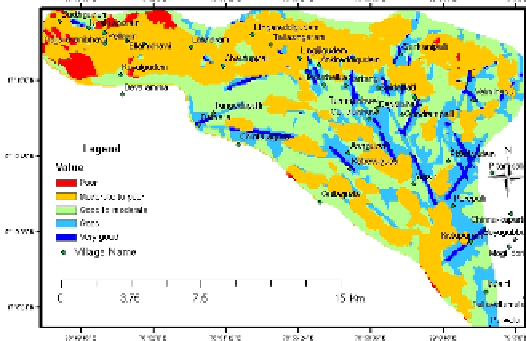
Fig. 2.
Integrated map of Kongal Basin.
cumulative effect of geology, geomorphology, drainage density, and linea-
ments, the final selection of drilling sites needs further probing using other
techniques such as geophysical investigations. The area classified as VG
may have very good yield. The total area is about 3% of entire basin. Sim-
ilarly the area marked by G may be considered to have good yield. It is
about 18% of the total basin. The area marked by MG and MP may yield
moderately good to moderately poor. These areas occupy nearly 38% each
of entire basin. The poor prospect of groundwater is indicated by P, which
occupies about 3% of basin.
3. Characterization of Groundwater Potential Map
In order to characterize the different groundwater potential zones deci-
phered through GIS, hydrogeological data like well yield, depth to water
level and groundwater quality have been collected and analyzed.
Well yield
: The yield of the wells have been found to vary from 699
to 10 m
3
/day. These values have been classified with respect to the differ-
ent groundwater potential zones as described above. Although, there is no
distinguishable variation in the yield of wells; however, large percentage of
high yield wells are found in VG and G zones whereas large percentage of
low yield wells are found in MG zone.
Depth to water level
: Occurrence of groundwater in various zones have
been measured in terms of depth to water level below ground level. It has