Geoscience Reference
In-Depth Information
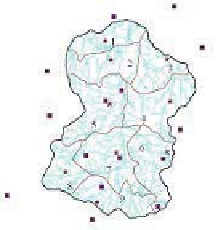
(c)
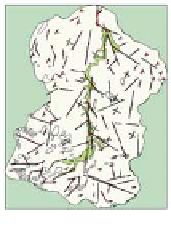
(a)
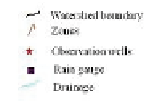
(b)
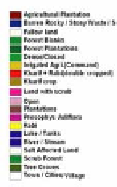
Fig. 2. Thematic maps of (a) land use, (b) structures, and (c) map showing rain gauge,
observation well network along with zonation structure for the subbasin.
draft data is obtained for each of the villages of the subbasin during 1992-
1994, which is used to assess draft for each of the subzones. These data,
along with the temporal variation of draft estimated at taluk (administra-
tive unit) is used to estimate the draft for each of the years from 1979 to
2000 for all the subzones.
3. Results and Discussion
3.1.
Groundwater dynamics
The distributed groundwater flow model Visual MODFLOW is used for
simulating the groundwater behavior in the subbasin, combining the inputs
from the field data collected for the homogeneous zones. It is assumed that
the study region can be described as an unconfined groundwater aquifer
at a regional scale. A simple rainfall recharge relationship is used, assum-
ing recharge as a linear function of rainfall. For the recharge component
from return flows due to surface and groundwater irrigation areas, recharge
is assumed to be a percentage of the amount of irrigation depending on
the type of crop and type of irrigation, based on the norms available for
this region.
5
MODFLOW is calibrated during the period from May 1977 to
April 1979 for the entire subbasin comprising of nine homogeneous zones.
The calibration period pertains to a uniform draft scenario in most of the
subbasin, in addition to a considerably lower draft in comparison to later