Geoscience Reference
In-Depth Information
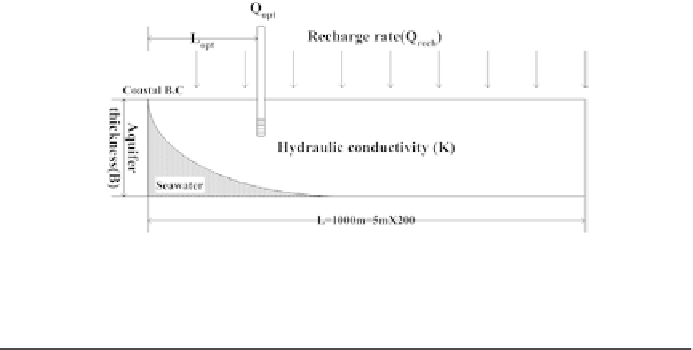
Fig. 1.
The schematic diagram of unconfined aquifer for the sensitivity analysis.
Table 1.
Investigated major parameters.
Depth of
Hydraulic
alluvium (m)
conductivity (m/sec)
SGD/precipitation (%)
Area
Min.
Max.
Min.
Max.
Min.
Max.
Nakdong River
5.2
15.2
15.2
344.23
2.93
3.2
Youngsan
6
20
30.77
248.48
2.11
2.48
Somejin River
Keum River
5.7
9.9
10.77
24.56
0.57
0.64
Buan-Gun
3.6
30
16
28
—
—
Table 1 presents the ranges of the hydraulic conductivity, of the recharge
rate and of the aquifer thickness deduced from previous studies.
3
-
6
Three
problems types are considered: wells with fixed locations, wells with fixed
pumping rates, and wells with both locations and rates are to be deter-
mined. The average annual precipitation (1,283 mm/year) of Korea is used
to calculate the recharge rate.
2.1.
Sensitivity analysis for the optimal pumping rate
In this section the sensitivity of the optimal pumping rate is investigated.
Figure 2 shows the perturbation of the optimal pumping rate as a function
of the change in the recharge rate and the hydraulic conductivity. For conve-
nience the pumping rate is normalized by the total recharge rate. As is seen
from the figure, the dimensionless optimal pumping rates are small in highly
conductive aquifers and in low recharge regions. The optimal pumping rate
increases with curvilinear relationships according to the recharge rate in the
low-conductive aquifer. However, the optimal pumping rate varies nearly
linearly with the recharge rate in highly conductive aquifers. The optimal