Geoscience Reference
In-Depth Information
decreasing
w
:
dw
dt
=
w
(
t
)
|
v
|
σ
i
n
i
,
(0)
∝
Φ
0
,
(1)
i
where
v
is the proton velocity,
n
i
the density of the
i
th neutral population,
and
σ
i
is the relative CE cross-section, i.e., the inverse of ion mean free
path for unitary neutral density.
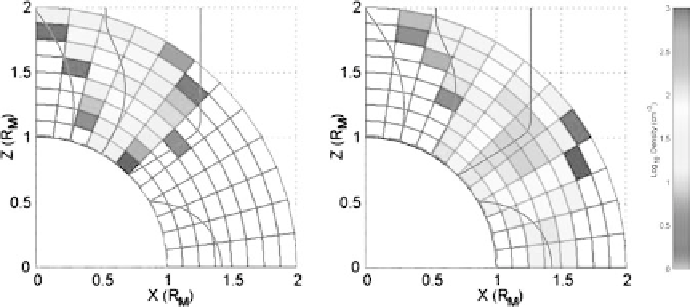
Figure 1 shows a generic H
+
simulated distribution in the north/dayside
part of the
xz
plane (in Mercury Solar Ecliptic coordinates (MSE):
x
MSE
towards the sun,
y
MSE
in the plane of ecliptic, perpendicular to
x
MSE
,z
MSE
perpendicular to
x
MSE
and
y
MSE
). Left panel refers to low-energy pro-
tons (100 eV-1 keV); right panel refers to high-energy protons (1-10 keV);
red circle is the planetary surface and blue lines are magnetic field lines.
According to our model, both high and low-energy protons precipitate along
magnetic field lines; high-energy protons precipitate at lower latitudes with
respect to low-energy ones, since, according to Massetti
et al.
8
the mean
energy of protons over the MP decreases with the latitude. Some of the
precipitating protons are reflected by the increasing magnetic field; the
others experience CE (1%) or reach the planetary surface (10%). During
this motion, protons are drifted northward by the
E
B
drift, and west-
ward by the grad-
B
drift. In this way, a second and a third population are
originated. The relative importance of these two drifts depends on fields'
strength and proton energy. The second population becomes stronger as
the electric field increases; the contrary happens to the third population.
×
Fig. 1. H
+
density over the
x
-
z
plane. Left panel: from 100 eV to 1 keV; right panel:
from 1 to 10 keV. Magnetic field lines are in blue.