Geoscience Reference
In-Depth Information
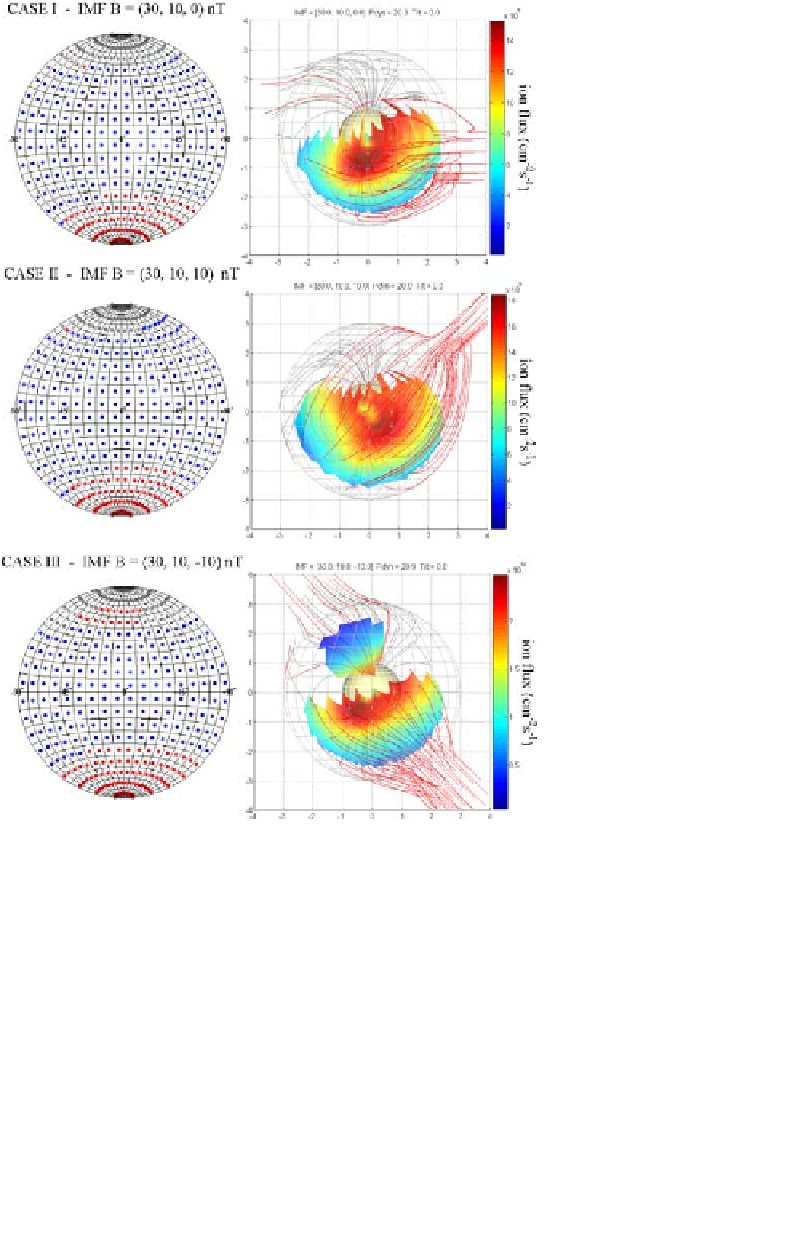
Fig. 3. Preliminary results obtained by means of the TH93* model, with
V
SW
=
430 km/s,
N
SW
=76cm
−
3
, under three different interplanetary magnetic field con-
figurations: IMF
B
=(30
,
10
,
0) nT (
top
), IMF
B
=(30
,
10
,
10) nT (
middle
)andIMF
B
=(30
,
10
, −
10) nT (
bottom
).
Left panels
: foot-point of closed (blue dots), open on the
dayside (cusps, red dots) and open tailward (polar cap, gray dots) magnetic field lines.
Right panels
: estimation of the magnetosheath plasma entry through the magnetopause
(gray mesh), along the dayside open field lines (red lines). The flux is calculated by taking
into account the magnetic reconnection effects (Eqs. (1)-(5)), and by assuming that 50%
of the incoming ions are reflected back at the magnetopause boundary. The fluxes shown
have to be compared with the unperturbed solar wind flux of about 3
.
3
10
9
cm
−
2
/
s
−
1
.
It can be noted that the highest fluxes are located near the subsolar region, where the
magnetosheath plasma is estimated to be about 3.5 higher than the upstream solar wind.
×