Geoscience Reference
In-Depth Information
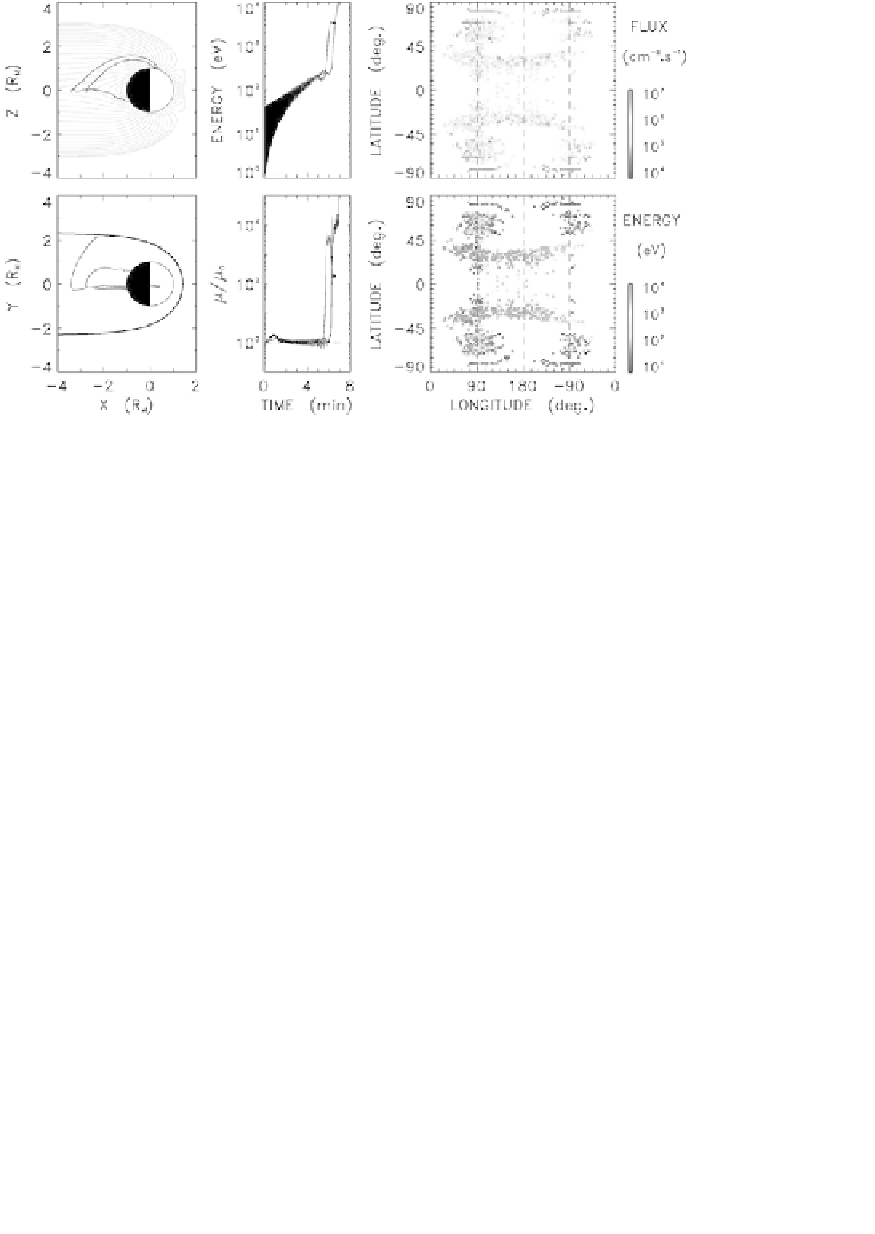
Fig. 2. (
Left
)ModelNa
+
trajectories projected in the noon-midnight plane and in
the equatorial plane. (
Center
) Corresponding energy and magnetic moment versus time.
(
Right
) Grey-coded flux and average energy of precipitating Na
+
ions as a function of
longitude and latitude (adapted from Ref. 2).
magnetosphere, Na
+
ions originating from Mercury's exosphere give rise
to two narrow bands of precipitation that extend over 10
◦
-20
◦
in latitude.
The average ion energy within these bands increases from post-midnight
to pre-midnight sectors, as expected from westward drift and associated
acceleration by the large-scale convection electric field. These energetic ion
bands contrast with those observed at high (above
50
◦
) latitudes in Fig. 2,
which correspond to downflowing exospheric populations that do not inter-
act with the magnetotail current sheet.
An intriguing feature in the right panels of Fig. 2 is the abrupt cutoff
of the Na
+
precipitation at latitudes of 35
◦
-40
◦
. In the Earth's auroral
zone, this poleward boundary roughly delineates the transition between
polar cap and plasma sheet, that is, the transition between the open flux
region and closed magnetic field lines that extend up to the reconnection
site in the far tail. In contrast, on the equatorward edge, precipitation is
controlled to some extent by stochastic motion in the inner plasma sheet,
the Isotropic Boundary (IB) of downward flux delineating the transition
between adiabatic and non-adiabatic transport (e.g., Refs. 11 and 12). At
Mercury, as far as IB is concerned, it is expected to occur at fairly low
∼