Geoscience Reference
In-Depth Information
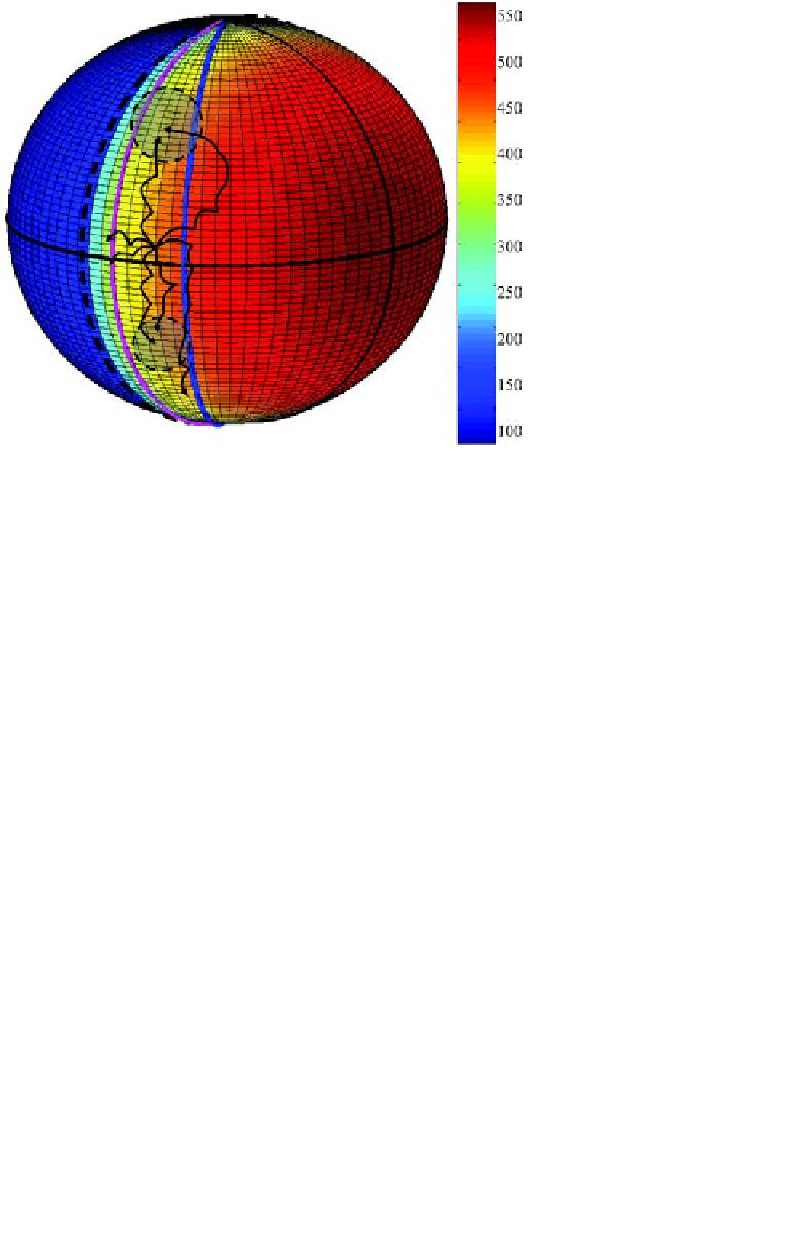
Fig. 2. Mercury's upper surface temperature calculated for average heliocentric Mer-
cury's distance as seen from Mercury's morning side. Thin horizontal dark line is for
the equator and vertical thin dark line for the subsolar line. Violet and blue thick lines
are longitude 10
◦
and 30
◦
after the dawn terminator (dashed dark line). Also drawn
are examples of trajectories of sodium particle in Mercury's exosphere starting from
equatorial early morning regions and moving by successive cycles of temporal absorp-
tion/ejection/reabsorption up to the moment when the time of residence in the regolith
gets of the order to the diurnal cycle.
should be even shorter for particle ejected by a more energetic process (with
less than few eVs). Therefore, the depletion of equatorial regions in favor of
higher latitude regions may occur during a period sucient enough to sig-
nificantly increase the absorbed volatile content of these latter regions. Such
regions should then release more absorbed volatiles than equatorial regions
and should be associated to high-latitude peaks of exospheric density.
9
However, Killen
et al.
10
argued that because of the high temperature of
the equatorial regions, the sodium atoms continue to diffuse to the extreme
surface of grains at a rate sucient to maintain all known source rates dur-
ing few Earth days. Therefore, this diffusion should reduce the signature
associated to the enhancement of absorbed volatiles in the upper surface
at high latitude when released into the exosphere. Moreover, more ener-
getic processes like photon-stimulated desorption and solar wind sputtering
should also deplete these enriched regions.